
Northview's Debt Optimization Lifts Q1 FFO 2.2%
Northview Residential REIT leaned on its balance sheet to grow earnings in a quarter that fought the weather. Reported May 7, 2026, Q1 saw FFO per unit rise 2.2%, driven by same-door NOI growth and continued interest savings from debt optimization, even as extreme cold across Northern and Atlantic Canada pushed operating expenses up 7.2% per GlobeNewswire.
Key Takeaways
- FFO per unit up 2.2%; interest expense fell 9.7% year over year.
- Average monthly rent up 4.2% to $1,527; occupancy eased to 95.0%.
- Leverage improving: debt-to-EBITDA 10.8x, down from 11.8x.
A Balance-Sheet-Led Quarter
The story underneath the 2.2% FFO gain is financing, not rent rolls. Interest expense fell 9.7% year over year as Northview kept reducing its credit facilities, and the weighted average credit facility rate dropped to 5.19% from 6.05% a year earlier per GlobeNewswire. That deleveraging shows up in the ratios — TTM debt-to-adjusted EBITDA improved to 10.8x from 11.8x, and the FFO payout ratio tightened to 57.7% from 59.4%. Operations held their own: same-door NOI grew 1.8% to $38.0M and average monthly rent rose 4.2% to $1,527, though occupancy slipped 100 bps to 95.0% as 129 suites in Northern Canada were transitioned to market rental.
The Market's Read
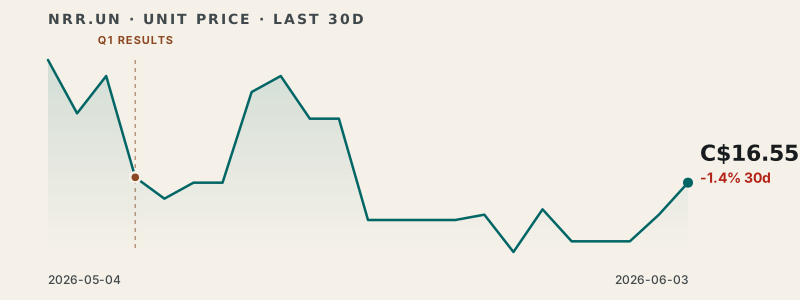
Northview trades around CA$16.16 against a Morningstar fair value estimate of CA$33.67 — a wide discount that National Bank partly leaned into when it raised its target to C$19 from C$18, keeping a Sector Perform rating per Morningstar.
The Bottom Line
Northview's quarter was won on the liability side: a 9.7% cut to interest expense and a full turn of deleveraging (10.8x from 11.8x) carried FFO higher despite a costly winter. With units near CA$16.16 and the FFO payout down to 57.7%, the income is well covered — but closing the gap to estimated value depends on operations, not just refinancing, doing more of the lifting.