Canadian REITs · IFRS-native · filing-grounded

The research terminal for Canadian REITs.

Analyze 32 actively tracked Canadian REITs on one normalized record — financials, filings, transcripts, and three named valuation views. Filing-derived metrics keep their source references.

From a list of tickers to a research view.

No spreadsheets, no PDF archaeology. Filing-derived metrics keep their source references.

Screen
Filter 32 actively tracked Canadian REITs by yield, sector, and payout safety — in one normalized table. Open the screener
Spot the risk
Read the distribution-safety verdict and filing-derived ratios with their source references attached.
Go deep
Open a REIT to inspect available Reported NAV, Real Estate NAV, Market-Implied NAV, structured earnings, FFO/AFFO builds, and consolidated broker-report research.
Track
Save a structured thesis and track your own holdings with FIFO cost-basis accounting. See the tracker

Provenance — primary documents first

Available source references remain attached to filing-derived metrics.

Page deep-links appear only when structured page metadata, a matching document URL, and the user’s access tier permit them.

Issuer filings

MD&A, annual reports, interim reports, and financial statements — sourced directly from each REIT's primary disclosures. Available source references remain attached to filing-derived metrics; page deep-links appear only when the required metadata, document URL, and access tier permit them.

Earnings calls

Full transcripts plus our structured 4-section summaries: call narrative, executive commentary, forward guidance, analyst Q&A. Summaries are audited against their source transcript — pull-quotes checked verbatim, figures traced to the text — and the running results are published on our methodology page.

Methodology & scoring

Built to be checked, not taken on faith. Scored extractions use REIT Stack's published 4-dimension rubric. Median internal composite extraction score (self-scored): 9.0/10 across the latest available score rows. This is not an independent accuracy measure. Material errors are documented in a public log.

Primary documents first. No broad-market terminal feed. No black box.

REIT Stack keeps each valuation method named and separately sourced.

Read the methodology →

REIT Stack keeps Reported NAV, Real Estate NAV, and Market-Implied NAV as separate valuation labels. Read the valuation methodology →

AI analyst — filing grounded

Your Canadian REIT AI analyst.

Each actively tracked REIT has an AI analyst grounded in its MD&A, financial statements, earnings transcripts, and REIT Stack's normalized data layer. Ask about Reported NAV, Real Estate NAV, Market-Implied NAV, payout risk, leasing, occupancy, cap rates, debt maturities, or management commentary — with source documents attached.

Filing-grounded answers

Ask a question and the answer cites the MD&A or transcript it came from.

Transcripts + MD&A by period

Pick the filing period and the answer is grounded on that quarter's filings — results, guidance, and management commentary, every claim sourced.

Property portfolio metrics

Interrogate WALE (weighted average lease expiry), occupancy, cap rates, leasing spreads, development exposure, acquisitions, and dispositions in one workflow.

Market context

Layer REIT-specific answers with context from consolidated broker-report research across cities and sectors.

Example AI analyst answer

Open a current sample analysis

Question: What stood out in CHP.UN's Q1 2026 results?

Choice Properties delivered Q1 2026 FFO per diluted unit of $0.271, up 2.7% YoY, with a 3.0% same-asset cash NOI growth driven by higher rental rates on renewals, new leasing, and contractual rent steps, while overall occupancy held at 98.1%. The REIT announced an agreement to acquire approximately $5 billion of First Capital REIT's retail assets, and advanced value-creation initiatives including the Bloor and Dundas revitalization.

CHP.UN MD&A — 2026 Q1CHP.UN structured extraction — 2026 Q1CHP.UN transcript — 2026 Q1

Actual output from the CHP.UN analyst, June 2026.

Built for analysts, advisors, portfolio managers, and serious REIT investors.

Explore the current sample REITIncluded with Pro and above.

Product record — annotated figures
The product, in its own screenshots.

Use Markets for live city and sector dashboards, and Research for written market-research reports.
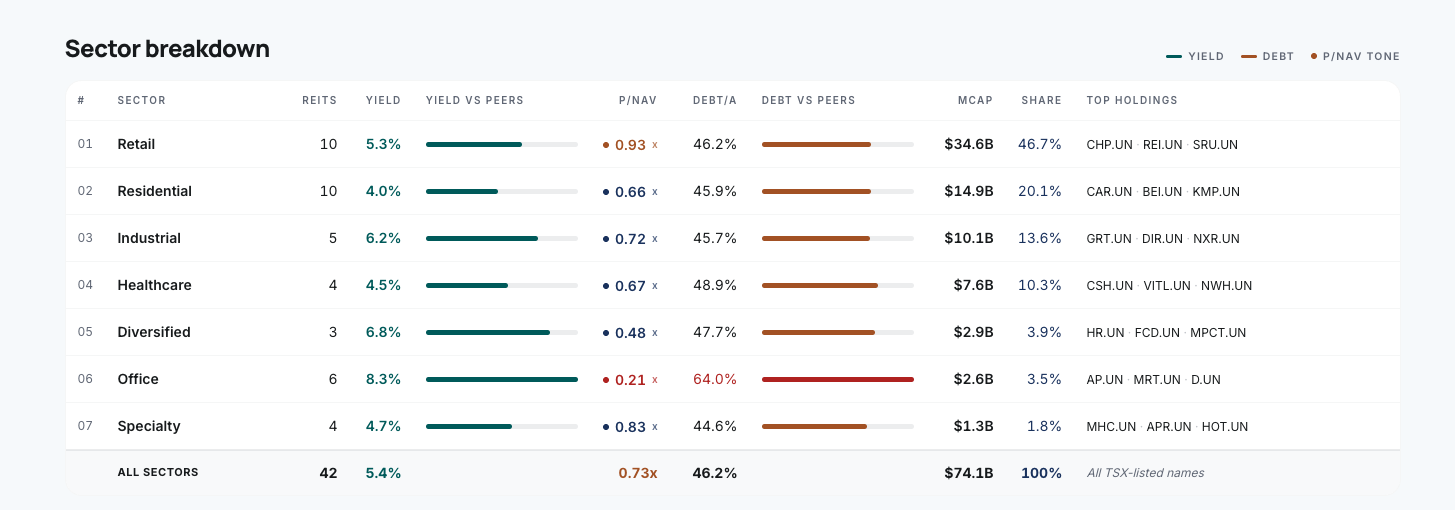
Canadian REIT Dashboard table showing all 32 actively tracked Canadian REITs grouped by sector with yield, P/Reported NAV, debt ratios, peer-relative bars, and top holdings
Canadian REIT Dashboard.A daily market dashboard for all 32 actively tracked REITs, grouped into 8 sectors and ranked on yield, P/Reported NAV, leverage, returns, and peer context.
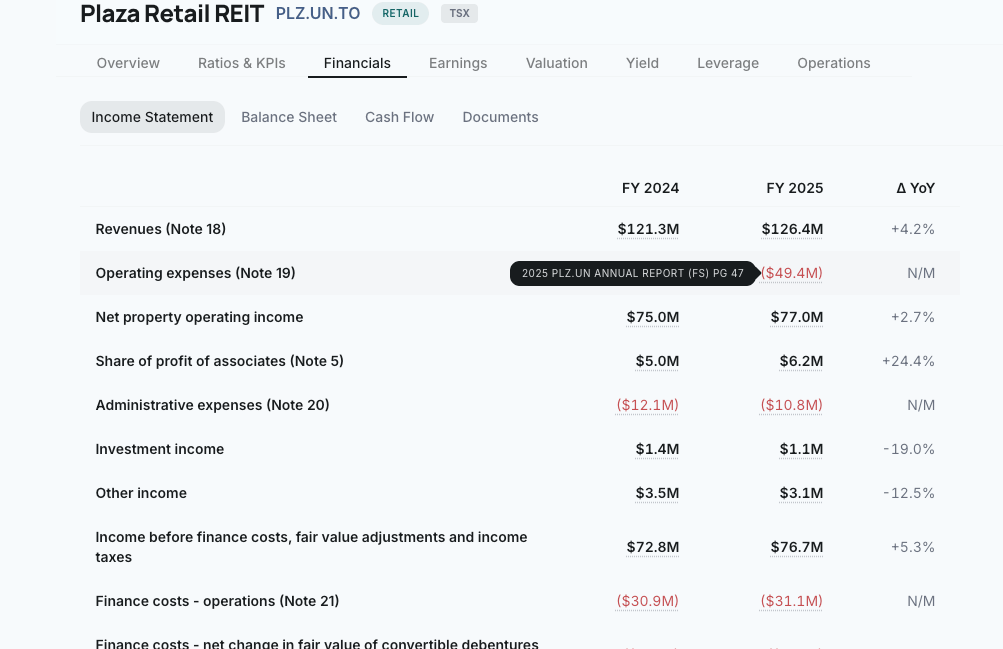
Income statement comparison FY 2024 vs FY 2025 for Plaza Retail REIT with note references and a tooltip showing the source filing page number
Source references stay attached.Open a filing-derived line to see its source document and note reference; page details appear where structured page metadata exists.
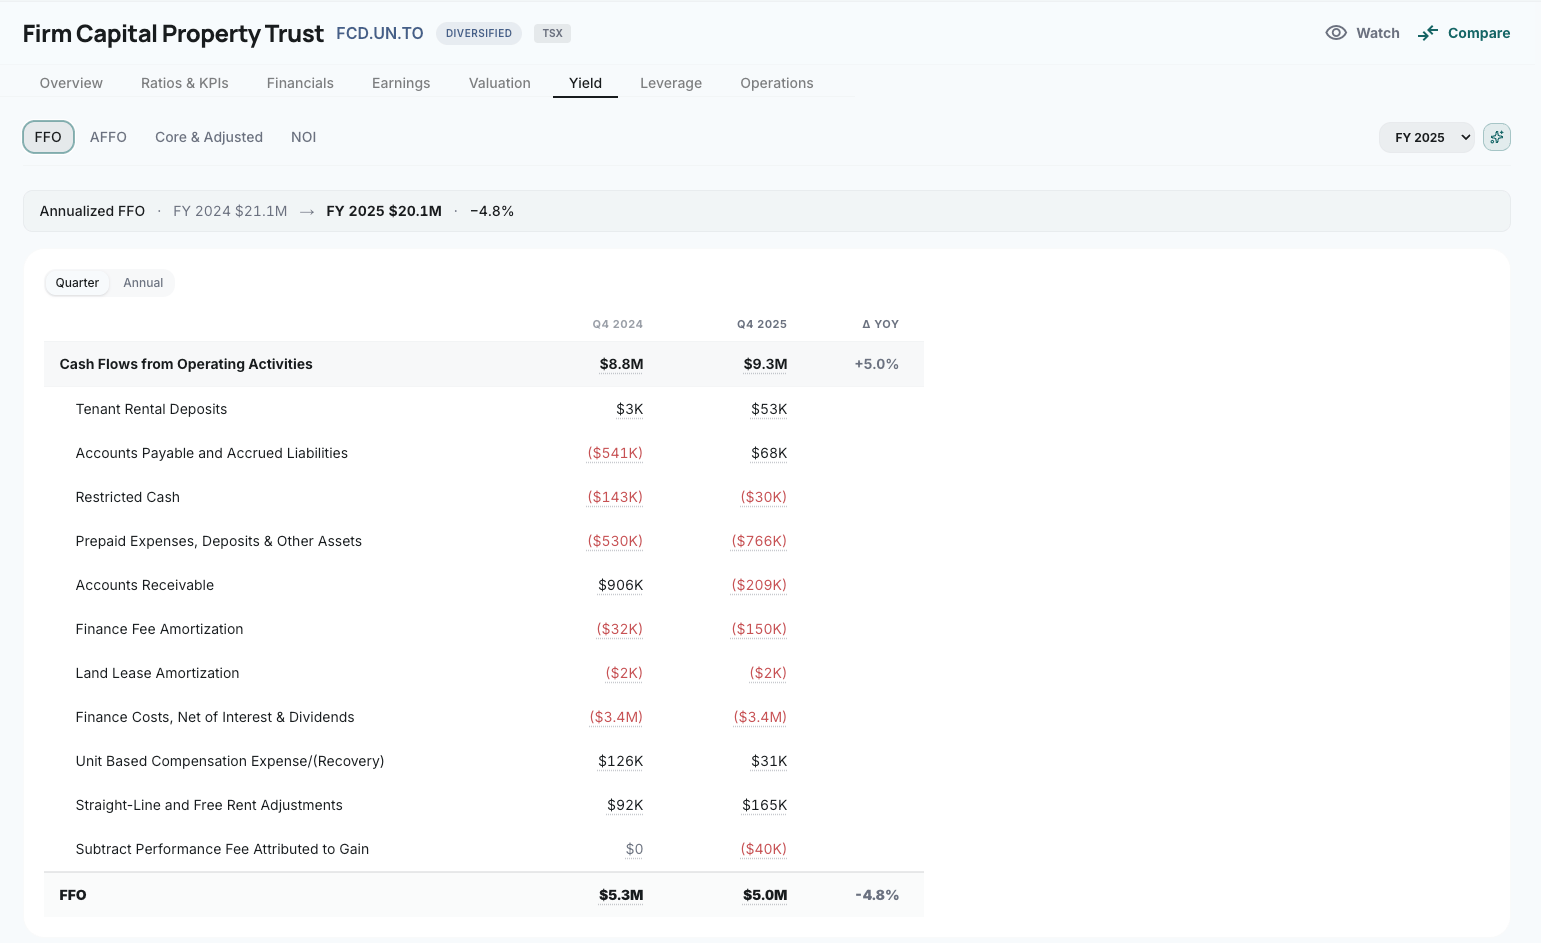
FFO build-up table for Firm Capital Property Trust showing line-by-line cash-flow-from-operations to FFO reconciliation across two quarters
FFO and AFFO, line by line.For this REIT, cash from operations → FFO → AFFO is reconstructed from the reported cash flow and issuer reconciliation tables.
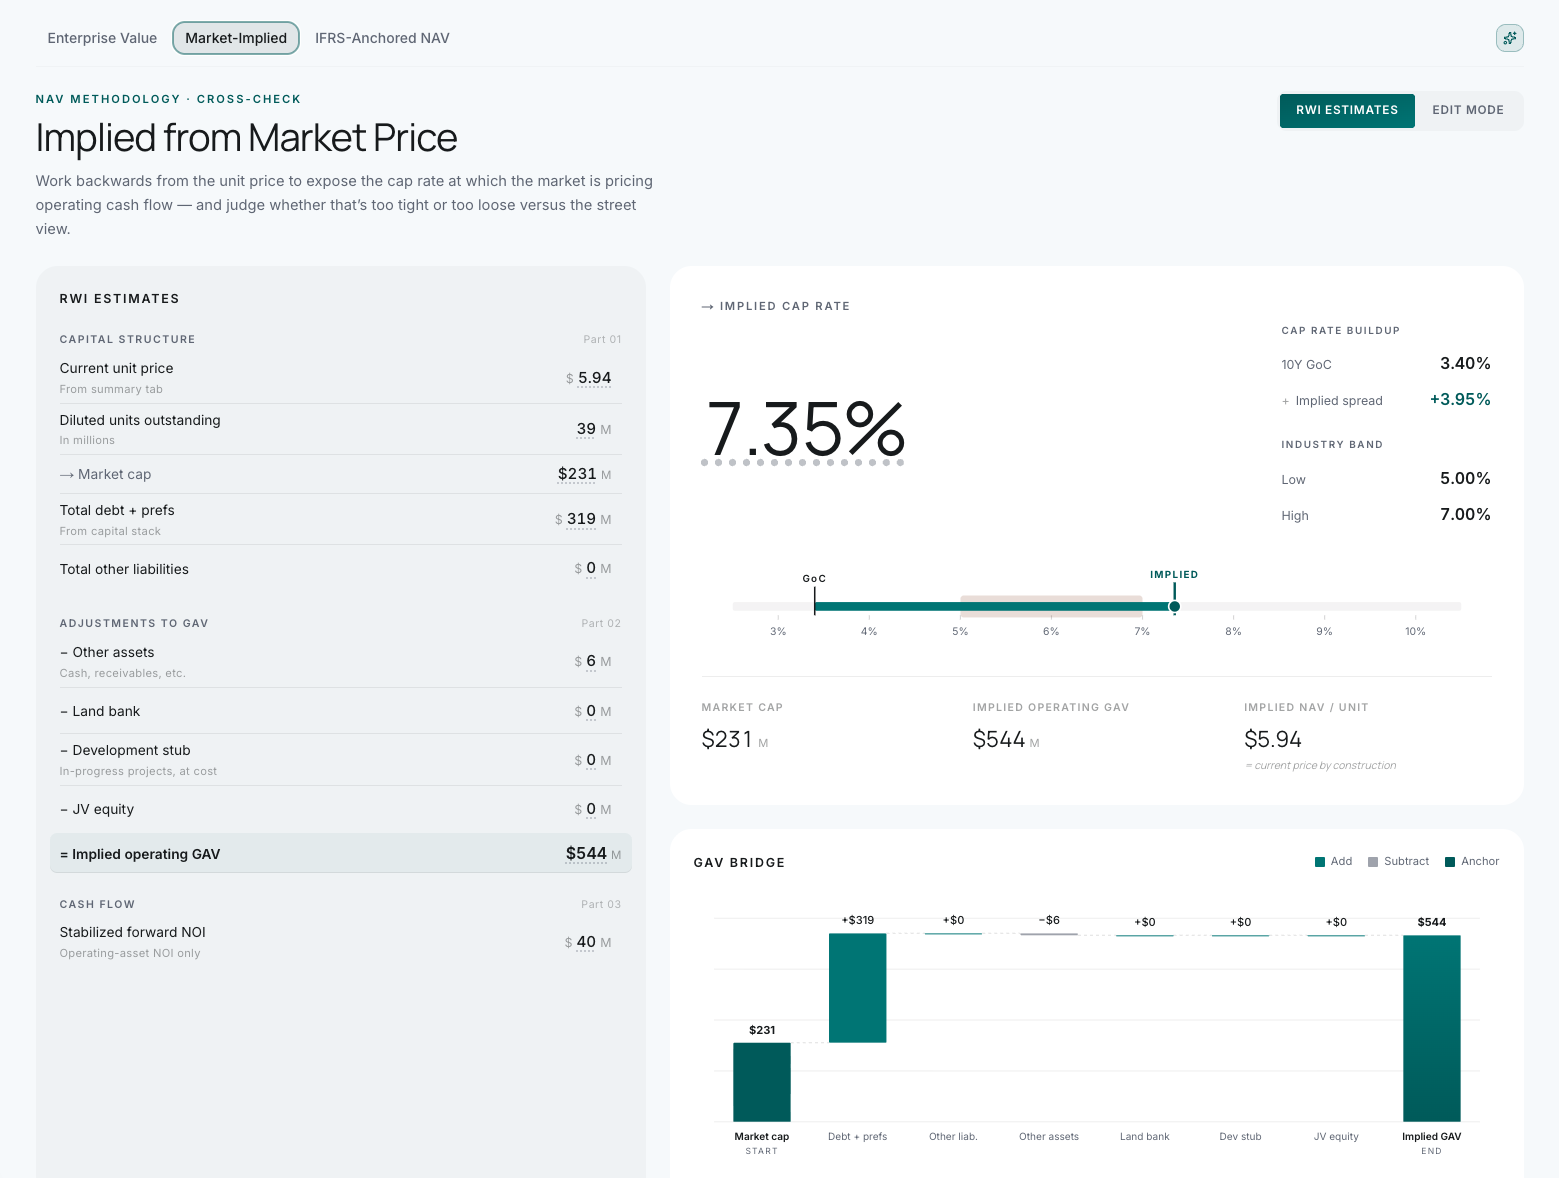
Market-implied valuation page showing implied cap rate of 7.35% with capital structure breakdown and a GAV bridge waterfall chart
Implied cap rate. GAV bridge.Work backwards from unit price to the cap rate the market is pricing, then compare against Real Estate NAV and source-cited valuation context.See the live sample analysis
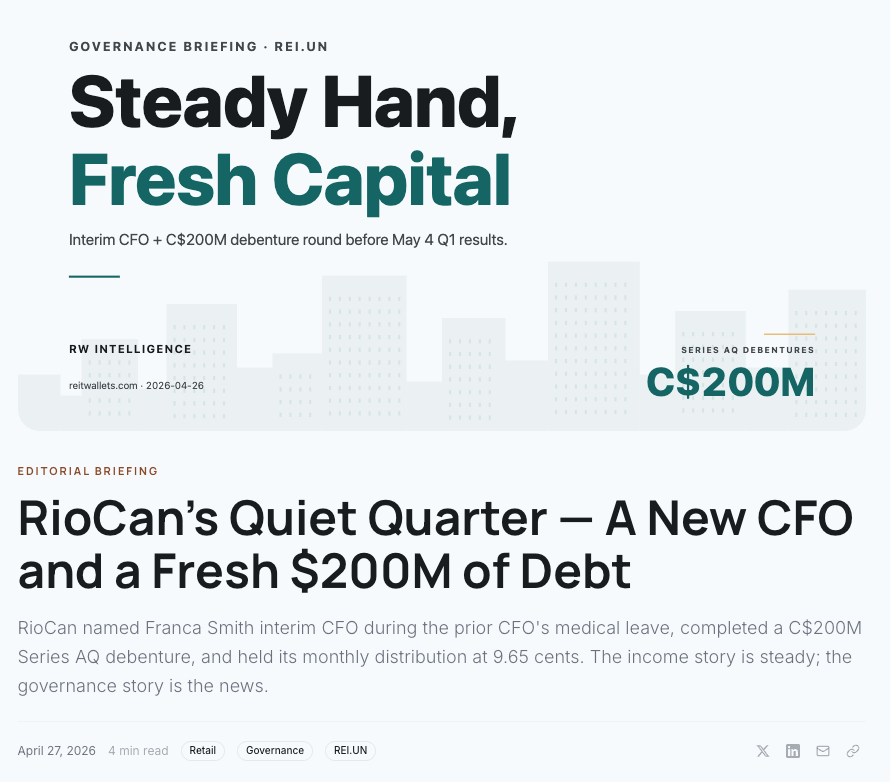
RioCan briefing post titled Steady Hand, Fresh Capital with branded editorial hero, C$200M debenture callout, and editorial body
Daily editorial briefings.Plain-English breakdowns of the day's REIT news — earnings, governance, capital raises. Branded covers, source links, ticker tags.
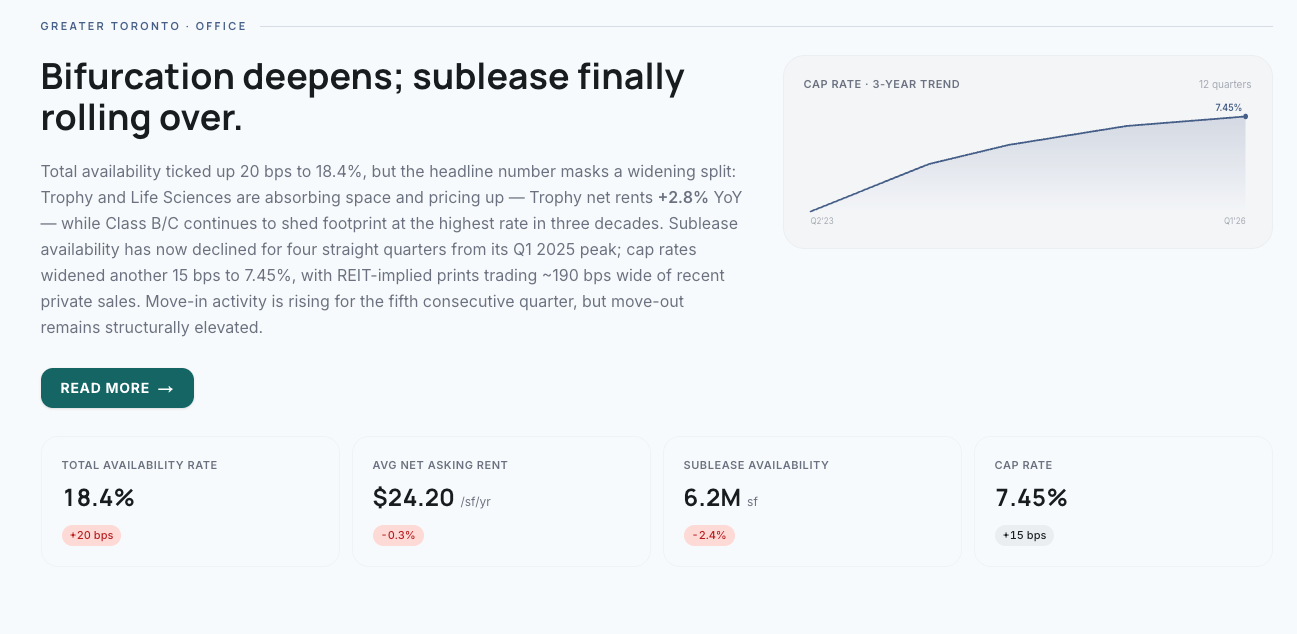
Greater Toronto Office research report showing a thesis paragraph with cap rate trend chart and four KPI cards for availability, rent, sublease, and cap rate
Consolidated broker-report research.Live city and sector dashboards run in Markets; written market-research reports live in Research, with source links attached.

Not a generic stock screen

Canadian REITs need filing-native analysis.

Generic stock screeners are built around standardized equity feeds. REIT Stack is built around the Canadian REIT metrics that determine comparability: FFO, AFFO, payout ratios, source-cited filings, property operations, debt schedules, and three distinct valuation views.
Why REIT Stack is different
Generic screenerREIT Stack
Starts with EPS, P/E, revenue, and broad equity factors.Starts with FFO, AFFO, payout ratios, leverage, and occupancy.
Treats valuation as a standard market multiple.Separates Reported NAV, Real Estate NAV, Market-Implied NAV, and implied cap-rate context.
Shows standardized feed fields without the filing trail.Keeps the source filing attached to each extracted number and editorial claim.
Leaves out debt ladders, WALE (weighted average lease expiry), same-property NOI, and leasing tables.Normalizes the REIT-native schedules that sit inside MD&A and supplementals.

Editorial ledger

From the briefings.

Daily REIT news and weekly market commentary — every briefing and roundup audit-checked against its sources before it publishes.

Get the briefings in your inbox.

New REIT Stack briefings when they publish. No promotion. Unsubscribe anytime.

Or read the full briefings archive

Kass Melle, founder of REIT Stack

Founder-led

Kass Melle

Kass Melle spent nine years in real estate private equity and development, most recently leading an 800,000 sq. ft. mixed-use project from the ground up to over 95% occupancy. That background of institutional real estate plus building AI-driven products is what REIT Stack is built on. He holds a bachelor’s degree in finance from UBC’s Sauder School of Business and completed his graduate studies in real estate development at Columbia University’s GSAPP. He leads the team behind REIT Stack.

Founded in 2026.

Reference desk

Common questions

How the data is sourced, how often it updates, and what we do — and what we don’t.
How is the data sourced and how do you know it's accurate?
Every filing-derived metric retains a source reference to the issuer's primary filing (MD&A, annual report, transcript); page details appear where structured page metadata exists. We extract into a normalized schema using an LLM-assisted pipeline wrapped by deterministic validation and a four-dimension composite scorer. Material errors are documented in the public error log on our methodology page.
How often does the data update?
Prices and FX: daily. News synthesis: daily, one record per REIT. Fundamentals from MD&A and annual reports: quarterly, on the issuer's filing calendar. Earnings call transcripts and our structured summaries: quarterly. Each dataset page notes the last refresh timestamp.
Why Canadian REITs only?
REIT Stack focuses on Canadian REITs because most Canadian REITs carry investment property at fair value under IFRS, while trust-unit structures, issuer-specific payout definitions, and MD&A disclosure patterns make this market a distinct normalization problem. Additional markets are not active in the product today; we will not add them until their accounting and filing conventions have their own shipped methodology.
Do you provide investment advice?
No. REIT Stack is a research tool. We publish normalized data, structured earnings summaries, Reported NAV, Real Estate NAV, and Market-Implied NAV methodology, and editorial commentary on Canadian REIT events. We do not issue buy/sell ratings, manage money, or provide personalized investment advice. Users should consult a licensed advisor for investment decisions.
Can I switch plans anytime?
Yes. Upgrade or downgrade at any time. Changes take effect immediately, and we prorate billing.

Open the Canadian REIT ledger

Start screening Canadian REITs.

Free access across all 32 actively tracked Canadian REITs. Upgrade for full history, exports, and deeper research.