Level: Advanced · Lesson: ~20 minutes · The build: ~45–60 minutes · Course 1 of 6 in the Advanced track
Prerequisites: Beginner Course 6 (leverage and debt basics), Course I-1 (the disclosure package), Course I-4 (fair value and Real Estate NAV). You already know what debt/GBV and interest coverage are and where the debt note lives. This course takes the liability side apart instrument by instrument — because every course after this one prices risk off what you build here.
By the end of this course you will be able to:
- Inventory a REIT's complete liability stack from the debt note and rank every claim — who gets paid first, and what the unencumbered pool actually buys an unsecured borrower
- Explain CMHC-insured financing mechanics — premiums, certificates, transferability, renewals — and why they change what a given leverage ratio means
- Read a covenant package, separate true covenants from management metrics and indenture definitions from MD&A headline ratios, and compute headroom as a distance to breach rather than asserting it
- Convert the maturity ladder into a refinancing-erosion schedule: the FFO cost, per year, of rolling below-market debt at the marginal rate
- Extract a REIT's real rate exposure from the IFRS 9 disclosures — fixed/floating mix, swap positions, and where the hedge marks go
1.1 The stack and its pecking order
Beginner Course 6 treated "debt" as one number with two summary statistics. Open the debt note of any TSX REIT and you will find it is nothing of the sort. A Canadian REIT's liability stack is assembled from up to five instrument families, and they are not interchangeable — they differ in what secures them, who gets paid first, what they cost, and what they leave behind for everyone else:
CMHC-insured mortgages. Property-secured debt whose lender additionally holds default insurance from Canada Mortgage and Housing Corporation, a federal Crown corporation, under the National Housing Act program. Available only for multi-family residential. The lender's credit exposure is effectively to the federal guarantee, not the building — which is why this is the cheapest term debt in Canadian real estate, and why Section 1.2 exists.
Conventional secured mortgages. Property-secured debt priced off the asset and the borrower. First claim on the specific pledged property. Every dollar of secured debt encumbers an asset — removes it from the pool available to other creditors.
Senior unsecured debentures. Bonds issued under a trust indenture, secured by nothing and therefore by everything: unsecured lenders rank behind every mortgage on every pledged asset, and their protection is the unencumbered pool — assets no one else has claimed — plus the covenant package in the indenture. Access to this market effectively requires an investment-grade credit rating.
Credit facilities. Bank revolvers and term loans, secured or unsecured, floating-rate, used for liquidity and bridging. The undrawn portion is a liquidity reserve; the drawn portion is debt like any other, and its floating rate is usually where a "100% fixed" claim goes to die.
Construction loans. Floating-rate, short-term, drawn as a development spends — and frequently parked inside equity-accounted joint ventures where the GAAP balance sheet doesn't consolidate them. The proportionate-share reconciliation (I-1) is where you find them.
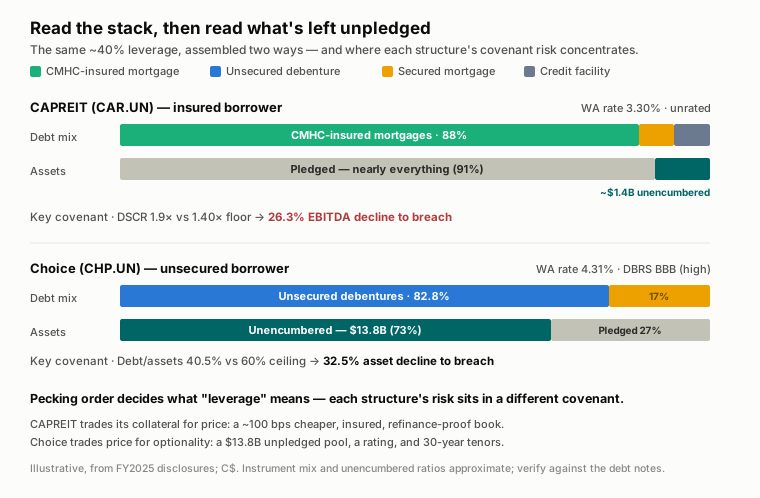
The pecking order matters because it determines what "leverage" means. A REIT at 40% debt-to-assets that has pledged 90% of its portfolio to mortgage lenders is a very different credit from a REIT at 40% whose assets are almost entirely unencumbered — the first has spent its collateral; the second is holding it in reserve. The single most underrated line in the debt disclosure is the unencumbered asset pool: for an unsecured borrower it is the collateral backing the debentures without being pledged to them, the raw material for future secured borrowing in a crisis, and a covenant input. When you read a debt note from now on, your first two questions are: what is the stack, in order of claim? and what's left unpledged?
1.2 CMHC mechanics — the Canadian specialty
Nothing distinguishes Canadian REIT balance sheets from their US peers more than CMHC-insured financing, and almost nothing is analyzed more lazily. The standard line — "apartment REITs get cheap government-insured debt" — is true and insufficient. The mechanics are where the analysis lives.
The insurance is on the loan, for its full amortization period. The borrower pays CMHC a premium — typically upfront, at the initial financing — and receives coverage that runs with the amortization of the mortgage (commonly 25 to 40 years), not its term (commonly 5 or 10 years). The premium buys decades of coverage across multiple renewals.
Premiums are capitalized, not expensed. Under the accounting Canadian issuers apply, the premium is netted against mortgages payable as a prepaid balance and amortized through interest expense over the amortization period of the underlying mortgage. CAPREIT — the sector's defining CMHC borrower — carried $104.7M of prepaid CMHC premiums netted inside its mortgage balance at December 31, 2025. The all-in cost of an insured mortgage is therefore the coupon plus the premium drip; the coupon alone understates it.
The certificate outlives the mortgage — and the lender. The unamortized insurance is transferable between CMHC-approved lenders and remains effective for the full amortization period. Read that again as a risk statement: at every renewal for decades, the borrower shows up with the insurance already paid and portable, and lenders compete for a federally guaranteed asset. This is the mechanical reason apartment REITs refinance smoothly through cycles that freeze other borrowers out — the renewal decision facing the lender is nearly credit-risk-free.
This is why the leverage capacity is real. An apartment REIT running debt at levels that would imperil an office REIT is not (necessarily) being reckless: its marginal debt is cheaper, its refinancing is insured in the literal sense, and its lender pool is defended by a Crown guarantee. The cost side shows up plainly in the two stacks this course dissects: CAPREIT's mortgage book carries a 3.30% weighted-average effective rate; Choice's unsecured debentures carry 4.31% (both at December 31, 2025 — different asset classes and tenors, so treat the gap as an illustration, not a controlled experiment).
What analysts routinely miss:
- The premium is a real cost that hides in two places. It drips through interest expense over decades, and covenant coverage ratios are often defined to exclude it (Section 1.3) — so the covenant math flatters the all-in economics.
- Renewal is not refinancing. Renewing an insured mortgage at term-end continues the existing premium amortization; discharging it entirely triggers a write-off of the unamortized premium. Strategy shifts between "top-up at every renewal" and "run the certificate to maturity" visibly move the amortization line — CAPREIT's own disclosed shift toward using the full life of the Certificate of Insurance (COI) cut its premium amortization from $10.1M (FY2024) to $6.1M (FY2025).
- The program is a policy, not a law of nature. Issuers say this themselves in the risk factors: program terms can change, and the pool of CMHC-approved lenders is even narrower than the already-concentrated Canadian lending base. A structural advantage with a single federal counterparty is still a concentration.
1.3 Debentures: covenants read from the indenture, headroom computed
The unsecured borrower's contract with its lenders is the trust indenture (as supplemented per series), and its covenant package typically has three load-bearing tests: a ceiling on debt relative to assets, a floor under a coverage ratio, and a minimum unencumbered-asset requirement. Bank facilities layer on their own versions. The rating agencies — DBRS Morningstar and S&P in Canada — sit on top: the investment-grade boundary (BBB (low) and above at DBRS) is effectively the admission ticket to the unsecured market, and ratings feed directly into pricing: Choice's facility pricing is explicitly contingent on holding DBRS BBB (high) / S&P BBB+.
Two disciplines separate advanced covenant work from intermediate summary:
First: know which number is actually a covenant — and whose definition it uses. The MD&A's "Financial Condition" table mixes true covenants with management metrics that merely look like them, and the covenant ratios are computed under the indenture's or facility's definitions, not the MD&A's headline non-GAAP conventions. Choice's table is a clean specimen: Adjusted Debt to Total Assets (limit 60.0%) and Debt Service Coverage (minimum 1.5x) are covenants calculated per the Trust Indentures; Interest Coverage (3.2x) and Adjusted Debt to EBITDAFV (7.0x) appear in the same table but carry no covenant at all — they are management metrics. An analyst who reports "Choice has covenant headroom on interest coverage" has already made an error. And covenant definitions embed choices the headline metrics don't: Choice's covenant debt excludes the Exchangeable Units entirely (the IAS 32 liability from I-3 — a $5.9B "liability" that no debt covenant counts as debt); CAPREIT's facility-defined coverage ratios exclude CMHC premium amortization and Exchangeable LP Unit interest. Same words — "debt," "interest" — different contents. When the indenture's own definitions aren't reproduced in the MD&A, the indenture (filed on SEDAR+) is the primary source.
Second: compute headroom as a distance, never assert it. "Comfortably in compliance" is issuer prose. The analyst's version is: how large a shock, in the covenant's own units, until breach? Rearrange each covenant around the variable that moves:
Worked calculation (December 31, 2025 figures):
- Choice, debt-to-assets covenant: Adjusted Debt $7,609.8M ÷ Total Assets $18,802.4M = 40.5% against a 60.0% ceiling. Holding debt constant, assets can fall to $7,609.8M ÷ 0.60 = $12,683M — a 32.5% decline in asset values before breach.
- Choice, DSCR covenant: 2.9x against a 1.5x floor → EBITDAFV can fall 48.3% before breach.
- CAPREIT, debt-to-GBV covenant (Acquisition & Operating Facility): 39.3% against a 62.5% ceiling → GBV can fall 37.1%.
- CAPREIT, coverage covenants: interest coverage 3.4x against a 1.65x floor → 51.5% EBITDA headroom. But debt service coverage is 1.9x against a 1.40x floor → only 26.3%.
That last line is the payoff of computing rather than asserting. Both REITs' leverage covenants carry 30-plus points of asset-value headroom — the number everyone quotes. But among CAPREIT's two coverage tests, which are both shocked by EBITDA and so directly comparable, debt service coverage is far tighter than interest coverage — 26.3% versus 51.5% — because amortizing CMHC mortgages load heavy scheduled principal into the denominator every quarter. The REIT with the "safest" debt thus carries a surprisingly tight coverage covenant, hidden in a metric nobody quotes. Whether that coverage test or the leverage covenant actually breaches first depends on the shape of the downturn (§1.6); the division's job here is to surface the risk concentration the headline leverage number conceals.
1.4 The maturity ladder as a risk object
The debt note's maturity schedule reads like a repayment calendar. Treat it instead as a priced object: every rung of the ladder carries an in-place rate, and the difference between that rate and the marginal refinancing rate — what the next dollar of term debt costs today — is a scheduled, forecastable change to FFO. I-4 taught you that below-market debt is an economic asset in a Real Estate NAV context (the mark-to-market on debt). This section is the same fact with the sign reversed: that asset amortizes into FFO erosion as the cheap debt rolls.
Estimating the marginal rate. Don't model it from bond math — read it from the issuer's own recent prints. Choice issued 5-year money at 4.29% (January 2025) and 10-year money at 4.63% (August 2025). CAPREIT's Q1 2026 insured financings came at 3.50% (5-year) and its committed subsequent financings at 3.93% (8-year). Those are live, issuer-specific marginal rates, better than any curve you'd build.
The erosion computation. For each year of the ladder: principal maturing × (marginal rate − in-place rate) = incremental annual interest, a permanent step-up in run-rate once refinanced. Sum the steps cumulatively and divide by fully diluted units (I-3) to see the FFO-per-unit cost of the roll.
Worked calculation — CAPREIT, the disclosure gold standard. CAPREIT's MD&A discloses the ladder with the effective rate of maturing mortgages per year — exactly the table this analysis needs (most issuers make you approximate it). At December 31, 2025: $646.2M of Canadian mortgages mature in 2026 at a weighted-average 3.07%. At a ~3.9% marginal insured rate (its own committed 2026 prints), the 2026 roll costs $646.2M × 0.83% ≈ $5.4M of annual FFO, permanently. Cross-check against the issuer's own sensitivity disclosure: 100 bps on 2026 maturities = ±$6.5M — which is just $646.2M × 1%. It ties. And the history validates the method: CAPREIT's FY2025 Canadian refinancings rolled debt carrying 2.28% into new debt at 3.57% — a realized +129 bps erosion you can see marching through the ladder ($6.46M per 100 bps, year after year, on similar-sized rungs at 3.1–3.5% in-place rates).
The aggregation trap. The fair-value-of-debt disclosure (I-4) aggregates the whole book into one mark, and the aggregate can point the opposite way from the next five years. Choice's long-term debt: carrying $6,805.0M, fair value $7,020.0M — fair value above carrying, meaning the book's coupons exceed market yields in aggregate, driven by long-dated, high-coupon series (6.00% of 2032, 5.70% of 2034, 5.37% of 2055). Yet its near rungs are cheap money: 2.46% maturing 2026, 2.85% maturing 2027 — those roll up, eroding FFO, while the aggregate FV note whispers the opposite. Erosion is about the sequence, not the average. Always work the ladder year by year.
1.5 Hedging and rate exposure: a disclosure-extraction exercise
This section is deliberately compact. You do not need hedge-accounting expertise to analyze a REIT; you need to extract four facts from the IFRS 9 / financial-instruments note, and know one consequence:
- The true fixed/floating split, counting drawn facility balances and construction loans as floating unless swapped. Both of this course's REITs are effectively fully fixed on term debt (Choice 99.9% GAAP-basis; CAPREIT 100.0% including synthetic fixing) — the floating exposure lives in facility draws.
- The derivative positions: notionals, rates, and maturities, read against the debt they hedge. A "fixed" position is only as long as its swap — synthetic fixing that matures before the underlying debt is a rate reset in disguise.
- Where the marks go. Choice applies cash flow hedge accounting: the unrealized effective swap mark parks in OCI, not net income (FY2025: a $1.0M unrealized loss in OCI — the depth Beginner 6 skipped). What does reach net income is the swap's realized settlement each period, which recycles out of OCI into interest expense — so the hedged, net-of-swap interest cost is already in FFO; it is only the unrealized mark that stays outside it. CAPREIT applies no hedge accounting at all: every derivative is FVTPL and its marks run straight through net income within fair value adjustments of financial instruments (FY2025: a $32.6M derivative loss in P&L).
- The consequence for your FFO work (I-2): FVTPL derivative marks are REALPAC-standard FFO reversals — CAPREIT's $32.6M swing is noise you strip out. The unrealized OCI mark never reaches net income, so there is nothing to reverse (the recycled settlement is already inside interest expense as real hedged cost, and belongs there). Two REITs can hold identical swaps and produce entirely different-looking income statements; after your I-2 rebuild, they converge. That convergence is the point.
Both REITs also run cross-currency swaps converting US-dollar facility draws to Canadian-dollar exposure — worth noting mostly so an unexpected "US$ borrowing" line doesn't read as currency risk when it's been swapped away at inception.
1.6 Worked example: two stacks, one country, different machines
Dated example block — figures as at December 31, 2025 (FY2025 audited statements and MD&A) with Q1 2026 updates noted; C$ millions. CAPREIT figures include European (ERES) mortgages unless noted; Choice figures are GAAP basis unless marked proportionate share.
| CAPREIT (CAR.UN) — the insured borrower | Choice (CHP.UN) — the unsecured borrower | |
|---|---|---|
| Total debt (carrying) | $5,964.9 (mortgages $5,633.6 + facilities $331.3) | $6,805.0 (debentures $5,632.4 + mortgages $1,167.3 + construction $5.3) |
| Stack composition (principal) | ~94% mortgages; 98.3% of Canadian mortgages CMHC-insured; no unsecured debentures | 82.8% senior unsecured debentures (14 series, 2026–2055); 17.2% secured |
| WA rate / term | 3.30% / 4.4 yrs (mortgages) | 4.28% / 6.5 yrs (indebtedness, proportionate share); debentures 4.31% / 5.8 yrs |
| Fixed-rate share | 100.0% (incl. synthetic fixing) | 99.9% GAAP (97.6% proportionate share) |
| Credit rating | None — no rated unsecured debt | DBRS BBB (high) Positive / S&P BBB+ Stable |
| Unencumbered assets | ~$1.4B (of $15.1B total assets) — nearly everything is pledged | $13.8B (proportionate share) — nearly nothing is |
| Longest term debt | ~10-year insured mortgages | Series X debentures due 2055 |
| Key covenants (actual vs limit) | Debt/GBV 39.3% vs ≤62.5%; ICR 3.4x vs ≥1.65x; DSCR 1.9x vs ≥1.40x | Adj. Debt/Assets 40.5% vs ≤60.0%; DSCR 2.9x vs ≥1.5x |
| Covenant headroom (own stress variable) | DSCR −26.3% EBITDA · Debt/GBV −37.1% assets | Debt/assets −32.5% assets · DSCR −48% EBITDA |
| FV of debt vs carrying | $5,584.9 vs $5,633.6 — below (below-market coupons) | $7,020.0 vs $6,805.0 — above (long-dated high coupons) |
| Refinancing evidence | FY2025: rolled 2.28% → 3.57% (+129 bps); 2026 rung: $646.2M @ 3.07% | FY2025: repaid 3.55% / 4.06%; issued 4.29% (5yr), 4.63% (10yr), 5.37% (30yr) |
| Liquidity | A&O facility $500 committed / $182 available (Dec 31/25) | $1,630 (cash + $1,500 undrawn revolver) |
Read the table as a design contrast, not a ranking — and that caution applies to the covenant-headroom row above most of all. The two headrooms shown for each REIT stress different variables (a fall in EBITDA versus a fall in asset value), so the smaller percentage is not automatically the covenant that binds: which one breaches first depends on how far EBITDA and asset values move together in a given downturn, and ranking them honestly needs a common stress scenario rather than a cross-unit comparison. What the row does show cleanly is where each structure's risk concentrates — CAPREIT's in debt service, Choice's in asset coverage. CAPREIT has traded its collateral for price: nearly every property is pledged, but the book costs ~100 bps less and renews under federal insurance — its risk concentrates in debt service (amortizing principal every quarter) and in policy exposure to a single program. Choice has traded price for optionality: it pays more, but holds a $13.8B unencumbered pool, a $1.5B undrawn revolver, an investment-grade rating that is itself an asset (its facility pricing depends on it), and access to tenors — 30-year unsecured money — that no mortgage market offers. Note also what neither stack shows: Choice's income statement charges $304.1M of Exchangeable Unit distributions to interest expense (more than its $234.3M of debenture interest!), yet no covenant counts the Exchangeable Units as debt — the IAS 32 artifact from I-3, alive and well inside the liability stack.
Dated aside: Choice's April 2026 agreement to acquire ~$5.0B of First Capital REIT assets includes assuming $2.3B of FCR's unsecured debentures and ~$0.4B of mortgages — debt assumption at portfolio scale, and a reminder that the stack you model today can be restructured by one transaction. (Expected close H2 2026; re-run this course's build when it does.)
The build: Choice's debt schedule and refinancing-erosion curve (~45–60 min)
You will construct the course's central artifact from Choice's FY2025 debt note (annual statements, long-term debt and credit facility notes) — the same schedule A-2's model consumes as its financing stack. There is no separate answer key: the worked figures in the steps below are the check — build the schedule until it reproduces them.
Step 1 — Inventory (the schedule). One row per instrument: all 14 debenture series (coupon, maturity date, principal), mortgages payable (use the ladder's per-year principal; the note discloses only a portfolio-level 4.12% WA rate — record per-year mortgage rates as assumed at 4.12% and flag the assumption), construction loans, and the credit facility (committed, drawn, rate basis, maturity).
Step 2 — Verify against disclosure (checkpoint 1). Compute the debenture book's weighted-average coupon and term. You should reproduce the disclosed 4.31% (the exact figure computes to 4.312%) and 5.8 years. If you don't tie within a rounding digit, an entry is wrong — fix it before proceeding.
Step 3 — The ladder (checkpoint 2). Aggregate principal by maturity year. You should reproduce the note's schedule: 2026 $510.6, 2027 $595.1, 2028 $799.8, 2029 $790.2, 2030 $833.5, thereafter $3,296.1 (GAAP basis). Then rebuild it on a proportionate-share basis from the MD&A ($7,637.1 total) and note where the extra $812M lives — JV mortgages and JV construction loans that the GAAP ladder never shows.
Step 4 — The erosion curve (the output). Set the base marginal rate at 4.60% (Choice's own August 2025 10-year print, rounded), then run +0 / +100 / +200 bps scenarios (4.60% / 5.60% / 6.60%). For each maturing instrument: incremental annual interest = principal × (scenario rate − in-place rate). Roll debentures at their series coupons; roll mortgages at the 4.12% assumed in-place rate. Accumulate by year, 2026–2030.
Checkable outputs (base +0 bps scenario, debentures): 2026 Series Q +$7.5M; 2027 Series P +$8.8M; 2028 Series L +$3.1M; 2029 Series M +$8.0M; 2030 Series N + V +$7.4M. Cumulative run-rate erosion by end-2030, all instruments:
| Scenario (marginal rate) | Cumulative annual erosion | Per unit (723.8M fully diluted, I-2/I-3) | % of FY2025 FFO/unit ($1.069) |
|---|---|---|---|
| +0 bps (4.60%) | ~$37M | ~$0.051 | ~4.8% |
| +100 bps (5.60%) | ~$72M | ~$0.100 | ~9.3% |
| +200 bps (6.60%) | ~$108M | ~$0.149 | ~13.9% |
Step 5 — Interpret like an analyst. Three observations your finished curve should provoke: (1) even with no further rate shock, Choice's FFO carries a built-in ~1%-per-year headwind from rolling cheap 2020–2021 vintage debt — this is forecastable, scheduled, and routinely ignored; (2) the erosion is not linear across years — 2028's Series L at 4.18% barely erodes at base but doubles the pain at +200, so the scenario dimension matters per-rung, not just in total; (3) your +0 scenario's assumption cell (4.60%) is already stale the day you build it — date-stamp it, and refresh it from the issuer's next print. Keep your build: A-2 wires this schedule directly into the interest-expense forecast, and A-3 stresses it.
Analyst callout — the traps in this course
The covenant-definition trap. Covenants are computed under the indenture's or facility's definitions, not the MD&A's. Choice's covenant debt excludes $5.9B of Exchangeable Units; CAPREIT's covenant coverage excludes CMHC premium amortization. And half the MD&A's "Financial Condition" table may not be covenants at all — Choice's interest coverage carries no covenant. Headroom computed off the wrong definition, or against a metric with no covenant, is analysis-shaped noise.
The GAAP-vs-proportionate ladder. Choice's maturity ladder is $6.8B on a GAAP basis and $7.6B proportionate — the difference is JV mortgages and construction loans that the consolidated balance sheet never shows. Stress the ladder the lenders actually face.
The aggregate fair-value-of-debt mark. One number for the whole book can point the opposite way from the next five rungs. Choice's book marks above carrying while its 2026–2027 maturities are below-market coupons that roll up. Work the sequence, not the average.
CMHC premiums hiding twice. The premium drips through interest expense over decades and is excluded from facility-defined coverage ratios — so both the coupon and the covenant flatter the all-in cost of insured debt. Add the premium amortization back when you compare all-in costs across stacks.
Exchangeable distributions dressed as interest. At Choice, $304.1M of Exchangeable Unit distributions run through interest expense — more than the debenture coupons. Leave them in and every coverage ratio you compute is wrong; strip them (as the covenants and REALPAC both do) and remember the units sit in your denominator instead (I-3).
Synthetic fixing has a maturity date. "100% fixed including swaps" is only as durable as the shortest swap. Read notionals and maturities against the underlying debt; a swap that dies in 2026 against a facility drawn to 2028 is a scheduled rate reset.
Key terms
| Term | Definition |
|---|---|
| Liability stack | The full inventory of a REIT's debt instruments ranked by priority of claim: insured and conventional mortgages, unsecured debentures, credit facilities, construction loans. |
| Unencumbered asset pool | Assets not pledged to any secured lender; the unsecured borrower's implicit collateral, crisis borrowing capacity, and covenant input. |
| CMHC-insured mortgage | Multi-family mortgage carrying federal default insurance under the National Housing Act program; the cheapest term debt in Canadian real estate. |
| Certificate of Insurance (COI) | The CMHC coverage attached to an insured loan — runs for the full amortization period (25–40 years), transferable between approved lenders, surviving renewals. |
| Prepaid CMHC premium | The capitalized insurance premium, netted against mortgages payable and amortized through interest expense over the mortgage's amortization period. |
| Trust indenture | The contract governing a debenture series; the primary source for covenant definitions and levels — filed on SEDAR+. |
| Covenant vs management metric | A covenant is a contractual test with a breach consequence; a management metric is a look-alike ratio with none. The MD&A table mixes them. |
| Covenant headroom | The distance to breach expressed in the shocked variable's own units (e.g., "assets can fall 32.5%") — computed, never asserted. |
| Maturity ladder | Debt principal scheduled by repayment year, each rung carrying an in-place rate; the course's central risk object. |
| Marginal refinancing rate | The rate on the issuer's next dollar of term debt, evidenced by its most recent prints — not the portfolio's weighted average. |
| Refinancing erosion | The scheduled FFO cost of rolling below-market debt: principal × (marginal − in-place rate), cumulating year by year. |
| Cash flow hedge / OCI | Hedge-accounting treatment that parks the unrealized effective derivative mark in other comprehensive income rather than net income; when the hedged cash flows occur, the accumulated amount recycles from OCI into interest expense (or the relevant P&L line), so it does reach profit or loss. |
| FVTPL derivative | A derivative carried at fair value through profit or loss (no hedge accounting); its marks hit net income and are REALPAC-standard FFO reversals. |
| Proportionate share basis | Non-GAAP presentation adding the REIT's share of equity-accounted JV assets and debt — where off-balance-sheet construction loans surface. |
| DSCR | Debt service coverage ratio: earnings against interest plus scheduled principal amortization. A coverage test that is often the binding constraint for an amortizing mortgage borrower (as it is among CAPREIT's coverage covenants here) — but which covenant actually breaches first depends on the stress path (§1.6): a leverage covenant can bind earlier when asset values fall faster than earnings. |
Knowledge check
1. CAPREIT holds a ~$1.4B unencumbered pool on $15.1B of assets; Choice holds $13.8B. Neither number is a mistake. What has each REIT bought with its choice?
CAPREIT has spent its collateral on price: pledging nearly everything to CMHC-insured lenders buys a 3.30% book with federally insured renewals — the cheapest, most refinance-proof debt available, at the cost of flexibility and a concentrated dependence on one federal program. Choice has spent price on optionality: its 4.31% debenture book costs more, but the $13.8B unpledged pool backs an investment-grade rating, a $1.5B revolver, 30-year tenors, and emergency secured-borrowing capacity. The stack is a design decision; the analyst's job is to price the design, not rank it.
2. Both of CAPREIT's headline covenants show enormous headroom: debt/GBV 39.3% vs a 62.5% ceiling, interest coverage 3.4x vs a 1.65x floor. Why does its real covenant risk sit in neither of these — and what does that teach about headroom work?
Its DSCR covenant (1.9x vs a 1.40x floor) breaches after only a 26.3% decline in EBITDA — versus ~51% for the interest-coverage test (3.4x vs 1.65x) — because amortizing CMHC mortgages load heavy scheduled principal into the denominator every quarter. So among the coverage tests, which are both shocked by EBITDA and therefore rankable, DSCR is the tighter one, not the interest-coverage ratio. The leverage covenant everyone quotes (debt/GBV, ~37 points of asset-value headroom) shocks a different variable and cannot be ranked against the coverage tests by a raw minimum: a 40% asset decline with flat EBITDA breaches debt/GBV first, while a 30% EBITDA decline with flat values breaches DSCR first. The lesson: compute each covenant's distance to breach in its own shocked variable, compare within a variable freely, and rank across variables only under a common operating-and-valuation stress path — never by taking a minimum across unlike units.
3. CAPREIT has $646.2M of mortgages maturing in 2026 at a weighted-average 3.07%, and its recent insured financings priced around 3.9%. Compute the refinancing erosion, and reconcile it with the issuer's disclosed sensitivity of ±$6.5M per 100 bps on 2026 maturities.
Erosion = $646.2M × (3.90% − 3.07%) = ~$5.4M of incremental annual interest, permanent once refinanced. The disclosed sensitivity is the same arithmetic with a 100 bps shock: $646.2M × 1.00% = $6.46M ≈ $6.5M. It ties — which is the point: the erosion schedule isn't a modeling exotic, it's the issuer's own risk disclosure extended across every rung of the ladder and anchored to a real marginal rate instead of a hypothetical shock.
4. Choice's long-term debt has a fair value of $7,020M against a carrying value of $6,805M — the market says its debt is worth more than book. Yet the erosion curve you built shows FFO falling as debt rolls in 2026–2027. Reconcile.
The fair-value mark aggregates the entire book: long-dated, high-coupon series (6.00% of 2032, 5.70% of 2034, 5.37% of 2055) trade above par and dominate the aggregate. The near-term rungs — 2.46% maturing 2026, 2.85% maturing 2027 — are below-market and roll up to the ~4.6% marginal rate. Both facts are true simultaneously because the FV note is an average and erosion is a sequence. An analyst who reads "FV above carrying" as "no refinancing risk" has been fooled by aggregation.
5. Choice and CAPREIT both use interest rate and cross-currency swaps. Choice's marks appear in OCI; CAPREIT's appear in net income. Why, and what must your FFO rebuild (I-2) do in each case?
Choice applies cash flow hedge accounting under IFRS 9, so the unrealized effective hedge mark parks in OCI rather than net income — nothing there to reverse in the FFO rebuild; the realized settlement, though, recycles out of OCI into interest expense each period, so the hedged interest cost is already in FFO and stays. CAPREIT applies no hedge accounting: its derivatives are FVTPL and their marks ($32.6M loss in FY2025) run through net income inside fair value adjustments of financial instruments — a REALPAC-standard FFO reversal you strip out. Identical economics, different accounting elections, different-looking income statements; after a correct I-2 rebuild, the two converge. The disclosure difference is presentation, not risk.
Sources: Choice Properties REIT FY2025 audited consolidated financial statements and annual MD&A (year ended December 31, 2025) and Q1 2026 interim statements and MD&A (three months ended March 31, 2026); CAPREIT FY2025 annual report (audited statements, notes, and MD&A) and Q1 2026 interim statements and MD&A; REALPAC, FFO & AFFO for IFRS White Paper (January 2022). Covenant levels are as disclosed in each issuer's MD&A financial-condition tables (calculated per the applicable trust indentures and credit agreements). The 4.60% base marginal rate in the build and the ~3.9% CAPREIT marginal rate are assumptions anchored to each issuer's disclosed 2025–2026 issuance prints — date-stamped, refresh from the next print. Headroom distances and erosion figures are analyst calculations from disclosed inputs, shown in full. All figures C$; market-dependent figures are as at the stated reporting dates.
Previous: Course I-6 — Comparative Analysis (Intermediate capstone). Next in the track: Course A-2 — The Full Model: Forecasting FFO, AFFO, and Reported NAV.