Level: Advanced · Lesson: ~20 minutes · The build: ~60–90 minutes (the track's largest) · Course 2 of 6 in the Advanced track
Prerequisites: the full Intermediate track and Course A-1. Every Intermediate skill returns here with a forward gear: I-5's same-property bridge becomes an engine you run into the future, I-3's dilution ledger becomes a projected unit count, I-4's fair-value work becomes a roll-forward, and A-1's debt schedule becomes your interest-expense forecast. Intermediate analysis reconstructs the present; this course builds the machine that projects it.
By the end of this course you will be able to:
- Architect a forecast model for a fair-value IFRS REIT — NOI-driven and layered, never net-income-driven — with per-unit outputs enforced by construction
- Forecast the same-property engine from the expiry ladder, disclosed leasing spreads, and inferred escalators, grading every driver by how contractual it is
- Wire the A-1 debt schedule into a quarterly interest forecast and close the funding equation — the model row where operations, capital plans, and the balance sheet must reconcile
- Roll the issuer's Reported NAV forward from retained FFO and development completions, with cap-rate marks isolated as explicit scenario inputs rather than forecasts
- Back-test the model against disclosed quarterly history, attribute errors to operations vs financing vs your own bias, and know which outputs deserve confidence
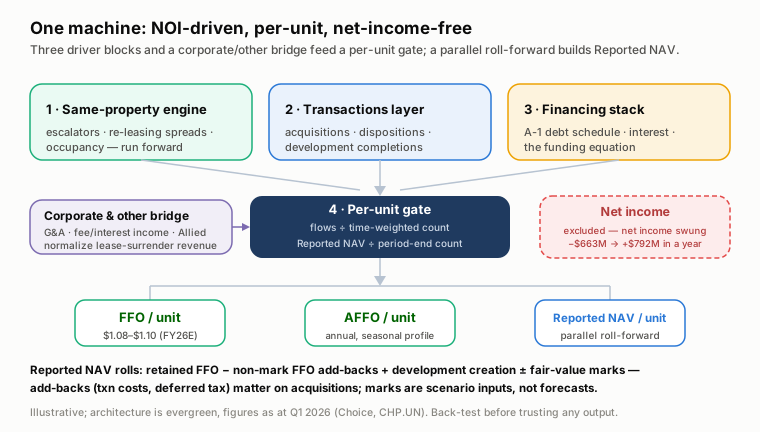
2.1 Architecture: what the model is, and what it must never be
Open the seven-quarter history of the site's running example and read one row aloud: Choice's IFRS net income, quarter by quarter, ran −$663.0M, +$791.9M, −$96.2M, −$154.2M, +$242.6M, −$53.4M, −$87.2M across Q3 2024 – Q1 2026. Over the same quarters, FFO per unit stayed inside $0.255–$0.278 — a smooth, two-cent band. You already know why (Beginner 2, I-2): net income is dominated by IAS 40 marks and the IAS 32 exchangeable-unit remeasurement, both of which are functions of future market prices. A model that forecasts net income is a model that forecasts the stock market and calls it accounting. So the first architectural decision is absolute: the model forecasts NOI, interest, and units — and builds FFO, AFFO, and Reported NAV from those. Net income appears nowhere.
The second decision is layering. A fair-value REIT model is four blocks wired in sequence:
- The same-property engine — the existing portfolio's NOI, run forward (this section and 2.2).
- The transactions layer — acquisitions, dispositions, and development completions entering or leaving the pool (2.3).
- The financing stack — A-1's debt schedule generating interest expense, plus the funding equation and unit count (2.4).
- The per-unit gate — every output divides by the projected fully diluted unit count before it is allowed to be called a result (I-3, now enforced by construction). Mind which count: FFO and AFFO are period flows and take the time-weighted diluted count; Reported NAV is a point-in-time stock and takes the period-end count (I-3). The two are identical while units are flat (Choice's base case) but diverge the instant the dilution module issues or buys back mid-period — the FCR module's ~111M — so the gate wires both denominators, not one.
Those four blocks build property cash flow, and one bridge stands between them and FFO: property NOI less interest is not yet FFO. REALPAC FFO is a trust-level measure, so the model carries a corporate & other bridge — trust G&A, fee and interest/investment income, and the distribution income from its fair-value (FVTPL) stake in Allied — plus the non-recurring items (lease-surrender revenue) that inflate a single quarter and must be normalized before anything is annualized. It is a required set of rows with its own forecast assumptions (2.4); a model that omits it silently freezes G&A and drops the fee and Allied lines, and then cannot tie to a single quarter of disclosed FFO.
Reported NAV runs as a parallel roll-forward consuming the same drivers (2.5). And here is the encouraging secret: the issuer's own MD&A already presents its results in exactly this architecture. Choice discloses Same-Asset NOI ($982.8M cash basis, FY2025) separately from Transactions NOI ($89.9M) — the disclosure is the model skeleton. Your work is to run it forward instead of reading it backward.
2.2 The same-property engine, run forward
Same-property NOI growth decomposes into three drivers, and the entire discipline of this section is knowing how contractual each one is:
Contractual escalators — rent steps written into leases, arriving on schedule regardless of markets. The catch: most issuers, Choice included, never quantify them. You infer them from the residual of the bridge (below) — and you label that inference as an inference.
The roll — expiring leases re-signed at market. Two disclosures price it: the expiry ladder (how much rolls, when, at what expiring rent) and leasing spreads (what re-signing achieves — use the first-year spread for near-term NOI, the long-term spread for value). This driver is a market assumption, but a bounded one: the ladder tells you exactly how much of the portfolio is exposed to it each year.
Occupancy — the swing factor. At 98%+ it contributes nothing on the upside and everything on the downside; model it as a scenario variable, not a growth driver.
Worked decomposition — Choice, 2026 (dated block, figures as at December 31, 2025). The ladder shows 2,132k sf expiring in 2026 — just 3.1% of GLA, carrying $32.6M of expiring base rent against $1,034.9M of total in-place rent (3.15%). At the FY2025 first-year renewal spread of +12.0%, the entire 2026 roll adds $32.6M × 12% ≈ $3.9M, or +0.38 points — but that is the annualized uplift, realized only once every 2026 renewal is in place. Its contribution to FY2026 same-asset NOI is smaller, because the renewals land throughout the year: on an even-timing (half-year) assumption, roughly half of it — ~+0.19 points — actually shows up in 2026 itself (apply the ladder's disclosed renewal dates to sharpen it). Yet guidance targets 2–3% same-asset cash NOI growth. The arithmetic bounds the rest: roughly 1.8–2.8 points must come from everything else in cash NOI — contractual rent steps, occupancy, and the expense side (operating costs net of recoveries) — none of which Choice itemizes. Treat that residual as an upper bound on the escalator, not a clean reading of it: cash NOI growth also carries recovery-ratio and operating-cost movement, so bridge the expense line before crediting the whole residual to contractual steps. Triangulated against history (FY2025 same-asset growth +2.2%, Q1 2026 +3.0%), the decomposition still tells you Choice's growth leans contractual — which is why its FFO path is so smooth and its upside so capped. A REIT whose growth is mostly roll (an industrial name with +29.5% spreads on big expiries) forecasts wider in both directions.
The single-counterparty wrinkle. Loblaw occupies 59.4% of Choice's GLA, and its leases expire in negotiated tranches: in FY2025, 39 of 41 leases in the 2026 tranche renewed at a weighted +8.6% spread for 5.0-year extensions. For most REITs the roll is a statistical assumption; for a sponsor-anchored REIT it is one negotiation, disclosed after the fact. Model the Loblaw tranches as discrete events at tranche-level spreads (the +8.6% print is your base rate), and the third-party space statistically. S-1 covers the relationship; the model just needs to respect its lumpiness.
Forecast decay. Quarter 1 of your forecast is mostly contract — escalators booked, spreads on deals already signed, occupancy nearly locked. Quarter 12 is mostly assumption. A model that presents both with the same font size is lying about its own confidence. The practical discipline: drive years 2–3 from scenario cells (spread ranges, occupancy bands) rather than point estimates, and let A-3 stress them. Your edge shrinks with the horizon; the model should say so on its face.
2.3 The transactions layer
Development is the most forecastable growth a REIT has — because issuers disclose the schedule. Choice's pipeline at Q1 2026: 13 active projects, 1,330k sf, $123.8M spent, $250.4M to complete over 12–24 months, blended target yield 6.25–6.75%, with completion timing disclosed by half-year: H2 2026 retail 105k sf ($54.9M at 6.25–6.75% ≈ $3.6M annualized NOI), H2 2027 industrial 1,108k sf ($288.8M at 6.00–6.50% ≈ $18M annualized). Enter each completion as a dated NOI step.
Two disciplines keep this layer honest. First, yield-on-cost is a target, not a lease: Choice's H2 2027 industrial number is dominated by Caledon Building D — 841k sf, unleased. An unleased completion needs a lease-up assumption (timing lag, probability, or a haircut), not just a date. Second, the capitalized-interest flip: while a project builds, its interest is capitalized (Choice: $9.7M proportionate share in FY2025, at 4.25%) and never touches FFO — I-2's species #3. At completion the capitalization stops. Every completion you model must therefore do two things at once: add NOI and migrate its share of interest from the balance sheet into interest expense. Models that book the NOI and forget the flip overstate accretion on every project (A-5 quantifies the flattery).
Acquisitions and dispositions are policy assumptions, not forecasts. You cannot predict deals; you can assume a run-rate consistent with disclosed behaviour (Choice FY2025: $459.8M acquired, $341.0M sold, both proportionate share) or hold the layer at zero and let scenarios carry it. Either is defensible; blending stale specific rumours into a base case is not.
The transactions layer is also where Reported NAV gets created rather than marked: completing at a 7.4% yield into a market capitalizing at 6.04% (Choice's FY2025 completions — $193.8M of cost, $46.9M of fair-value gain recognized over the development period) manufactures value the same-property engine never could. Hold that thought for 2.5.
2.4 The financing forecast, the funding equation, and the corporate bridge
Here A-1 pays off mechanically: your debt schedule is the interest forecast. Each instrument accrues at its coupon until maturity, rolls at your marginal-rate cell thereafter (the erosion curve, now a model row), and the covenant tests from A-1 run as monitors on every forecast quarter — a model that quietly breaches its own DSCR in Q7 is telling you something a point-estimate FFO line never would.
What the debt schedule can't tell you is the balance it needs to fund. That is the funding equation, the row where the model must reconcile every quarter:
Development spend + acquisitions + scheduled amortization − retained AFFO (AFFO − distributions) − disposition proceeds = change in facility draw (or new issuance) — a positive result is new borrowing to fund the gap; a negative result is surplus cash that pays the facility down or funds buybacks
For Choice in FY2025 the pieces were: AFFO $631.7M less distributions declared $556.1M = $75.6M retained, against ~$250M of committed development spend over 12–24 months — so the pipeline is funded by retained cash plus dispositions plus the facility, and your model's facility balance (at the facility's floating rate, feeding back into interest expense) is where any gap lands. If the projected draw grows without limit, your assumptions are inconsistent — the model just told you so.
The unit count. Choice is the deliberately easy case: no DRIP (none disclosed in the filings), no equity issuance, an NCIB used only to source unit-compensation settlements — the count has sat at 723.8M fully diluted (328.0M trust + 395.8M exchangeable) for five consecutive quarters. Build the dilution module anyway — DRIP proceeds, issuance, unit-comp — with every switch set to zero. You are building the machine, not just this REIT's instance of it; the next REIT you model will have the switches on. (And Choice's own switches flip if the FCR transaction closes: ~68.6M new trust units to FCR unitholders plus a ~$0.6B GWL subscription — ≈ +42M units at an assumed ~$14.4 issue price, so ~111M in total. See the aside below.)
Distribution policy as a constraint. Choice's pattern is legible: +1.3% effective each March ($0.76 → $0.77 → $0.78), FFO payout ~72%, AFFO payout ~88%. Model the distribution as policy (grow it on the observed schedule), then read the payout ratios your forecast implies. If your FFO path pushes AFFO payout past 100%, you haven't forecast a distribution cut — you've discovered that either your operating assumptions or the distribution policy has to give. That tension is a result, and A-4 scores it.
The corporate & other bridge — the rows the property blocks never produce. Property NOI less interest is not FFO. REALPAC FFO is a trust-level measure, so three recurring corporate lines have to be forecast explicitly, or the model cannot rebuild a single reported quarter:
- Trust G&A — a deduction; hold it at its run-rate share of assets (or of gross revenue), not frozen at a dollar amount. Choice's overhead scales with the platform, so a growing asset base grows G&A.
- Fee, service, and interest/investment income — a credit; grow it only on disclosed drivers (managed-property and administration fees, cash balances), never as a plug.
- Distribution income from the Allied stake — Choice holds Allied at fair value through profit or loss, not on the equity method, so (like the IAS 40 marks) the stake's fair-value change is reversed out of FFO and only the distributions received stay in. Forecast the distribution income — not Choice's share of Allied's earnings — carried at the disclosed rate; a year-over-year swing in it moves reported FFO growth with no property changing hands. Hold it until the stake itself changes.
Then strip the non-recurring items — lease-surrender revenue above all — which belong in this quarter's FFO but not next year's run-rate. Normalize them out of the seed quarter before you annualize (the mechanics are in 2.7's "annualizing a noisy quarter" note). Skip this bridge and the model silently freezes G&A and drops the fee and Allied lines — and then cannot reconcile to a single quarter of the issuer's disclosed FFO, which is exactly what 2.6's back-test surfaces first.
2.5 The Reported NAV roll-forward
Your FFO forecast and your Reported NAV forecast are one machine, bridged by a roll-forward:
Reported NAV(t+1) = Reported NAV(t) + retained FFO − non-mark FFO add-backs + development value creation ± property cap-rate marks ± non-property marks (FVTPL investments, OCI)
The first term is retained FFO (FFO − distributions), not retained AFFO — because Reported NAV is IFRS equity, and AFFO's sustaining-capex and straight-line-rent deductions are cash-timing and non-cash items that do not reduce equity: sustaining capex capitalizes into the fair-valued asset, and whatever value it fails to create shows up later in the marks term, not as a separate deduction. So the equity-basis retention is FFO less distributions; retained AFFO is the cash figure the funding equation (2.4) uses — a different question, and using it here systematically understates Reported NAV growth by exactly the AFFO adjustments. The first two terms come from rows you already built. The third is not a forecast — it is a scenario input. You have no edge predicting where appraisers move cap rates next quarter; what you have (I-4) is the sensitivity table converting any assumed move into dollars: for Choice, ±25 bps on the terminal cap rate = −$331M / +$358M, or about −$0.46 / +$0.49 per unit. Expose the cap-rate cell, default it to unchanged, and let A-3's scenarios move it. The fourth term is the one a property-only view drops: non-property marks. Because Allied is FVTPL (2.4), its fair-value change is reversed out of FFO — so retained FFO cannot carry it — yet it still moves IFRS equity, and therefore Reported NAV directly. Other FVTPL instruments and OCI movements (A-1's effective cash-flow-hedge marks) sit in the same bucket. Give it its own scenario cell beside the cap-rate cell, defaulted to unchanged; omit it and the roll-forward silently drops a real equity swing.
And one reconciliation the equation must not skip: retained FFO is not retained IFRS income. FFO adds back more than the marks — acquisition transaction costs, certain deferred taxes, specific intangible amortization (I-2) — items that did reduce IFRS equity but that FFO reverses out of income. A complete roll subtracts those (the − non-mark FFO add-backs term), or it overstates Reported NAV by exactly them. In an ordinary quarter they are immaterial and you can carry them at ~zero; in a quarter that books the FCR acquisition they are not — the deal's transaction costs and any deferred tax hit equity in that quarter, so a model that leaves them in retained FFO reports a Reported NAV that never happened.
One scope condition: this is a per-unit roll at a constant unit count — Choice's flat 723.8M base case. The moment the dilution module moves units, the per-unit figure needs the equity side rolled too, or it lies. A unit issuance (the FCR scenario's ~111M) adds the net new equity raised to total Reported NAV — but roll it in once: the units issued to the seller and the cash subscription are what pay for the acquired net assets, so counting both the equity in and the assets acquired double-counts the same deal. The clean way is to roll the module's full sources and uses — units and subscription cash in, acquired assets and assumed debt on the other side — so the numerator and the ~111M-unit denominator move together; a buyback runs the other way (cash and units out). Divide a larger denominator into an unchanged numerator and the model prints an artificial Reported-NAV-per-unit collapse that is pure arithmetic, not economics. Keep the equation above for the flat-unit base case; switch to that total-equity sources-and-uses roll (then ÷ the projected unit count) the moment issuance or buybacks are switched on.
Worked decomposition — Choice FY2025 (dated block). Issuer-disclosed Reported NAV per unit rose $14.07 → $14.43, a gain of $0.36. The roll-forward attributes it: retained FFO (FFO $773.7M − distributions $556.1M = $217.6M) ≈ $0.30/unit; development completion gains $46.9M ≈ $0.065/unit; the marks netted roughly flat — but that "flat" is a net, not a single quiet cap-rate line. Choice's Allied stake alone took an ~$87M Q4 2025 FVTPL mark-to-market loss (~−$0.12/unit) as Allied's distribution cut was priced in — a non-property mark that never touched FFO — which the property cap-rate mark and other equity movements offset to leave the small net gain. Label that residual a "flat cap-rate mark" and you would miss a real −$0.12 swing that merely happened to be cancelled this year. Read the decomposition as a confidence map: in FY2025 essentially all of Choice's Reported NAV growth was manufactured — retained earnings plus the development spread, both forecastable from your model's own rows — while the property and non-property marks roughly cancelled. In a year of falling cap rates the property-mark term dominates; in a year an equity stake re-rates, the non-property term does — a REIT whose Reported NAV growth is mostly manufactured compounds under your assumptions; one whose growth is mostly marks is borrowing it from the sensitivity table.
One anchor before you roll anything forward (I-3, I-4): seed with the issuer's disclosed Reported NAV per unit for the base quarter of your model — for a build off Q1 2026 actuals that is Choice's $14.53 straight from the Q1 2026 MD&A, not the FY2025 year-end $14.43 and not a number you recompute. Seed from the wrong vintage and every forecast quarter starts off by the gap — here $0.10/unit, which is exactly why the end-2026 checkpoint below rolls from $14.53. The build-up is a reconciliation you run as a check, never the definition: done on the fully-disclosed FY2025 year-end, IFRS unitholders' equity $4,584.8M + Exchangeable Units liability $5,861.6M = $10,446.4M, ÷ 723.8M ≈ $14.43 — it ties there; for an issuer whose disclosure carries adjustments beyond equity-plus-exchangeables — or a different period-end denominator — that reconstruction can drift from the disclosed scalar, so trust the disclosed per-unit figure and keep the build-up as the check, never the definition (Reported NAV is display-only; don't recompute total Reported NAV ÷ units). This bridge is Reported-NAV machinery — it advances the issuer's IFRS equity figure. If you disagree with management's marks, substitute your own cap rates into this build's marks term and roll the adjusted Reported NAV forward. What you should not do is seed it with a Real Estate NAV and turn the crank: Real Estate NAV is a different construction (forward NOI capitalized at market cap rates, then GAV − debt), so you forecast it by rerunning that NOI/cap/debt build with forward assumptions — not through this FFO-driven roll-forward.
2.6 Calibration and honesty
An unback-tested model is an opinion with formatting. The protocol: reconstruct what your model would have said with information available six quarters ago, run it forward, and lay it against the disclosed history (the MD&A's quarterly table hands you the actuals). Then attribute every miss to one of three bins:
- Operations — spreads, occupancy, or NOI came in off-assumption (your same-property engine needs recalibration);
- Financing — rates, issuance, or the funding equation surprised you (your A-1 inputs or marginal-rate cell were stale);
- You — the assumption was fine and you overrode it (the bin nobody keeps honestly, which is why you keep it in writing).
Choice's history also teaches what not to forecast quarterly. FFO per unit runs in a tight band (Q3'24–Q1'26: $0.255–$0.278) — forecastable. AFFO per unit swings violently within years ($0.151 in Q4'24; $0.249 the next quarter) because sustaining capex is seasonal: Choice's property capital ran $0.4M in Q1 2025 and $41.7M in Q3 2025. Same REIT, same year, two orders of magnitude. Forecast AFFO annually and profile the quarters on the disclosed seasonal shape — or accept that your quarterly AFFO line is decorative. And net income? The seven-quarter row from 2.1 is the permanent exhibit: don't.
Finally, guidance. Choice targets 2026 same-asset cash NOI growth of 2–3%, FFO per unit of $1.08–$1.10, and leverage below 7.5x debt-to-EBITDAFV. Use guidance as a cross-check, never a target: a model tuned until it matches guidance hasn't been validated — it has been correlated with another forecast, made by the party with the strongest incentive to be right slowly and wrong never. When your independent build lands inside guidance (the worked example below lands at ~$1.09–$1.10), that is mild comfort; when it lands outside, that is a finding — investigate which of you knows something.
2.7 Worked example: the Choice model skeleton — structure vs dated assumptions
The site convention, applied to modelling: the structure below is evergreen — the rows any fair-value REIT model needs. The base values are a dated block (as at Q1 2026 filings) that a refresh swaps out without touching structure.
| Driver (structure — evergreen) | Base value (dated: Q1 2026) | Source |
|---|---|---|
| Same-asset NOI, cash basis (annual run-rate) | $982.8M growing +2.0–3.0%/yr | FY2025 MD&A §7.2; guidance §14 |
| — of which the 2026 roll contributes | ~+0.4 pp annualized; ~+0.2 pp in FY2026 on even renewal timing (3.15% of ABR × +12% spread) | Expiry ladder + FY2025 spreads, MD&A §6 |
| — all other cash-NOI drivers: escalators, occupancy, and the expense/recovery side (inferred residual) | ~+1.8–2.8 pp (guidance less the ~+0.2 pp in-year roll) — inference, not disclosure; bridge the expense line before crediting escalators | Derived; triangulated vs FY2025 +2.2%, Q1 2026 +3.0% |
| Loblaw tranche renewals (discrete events) | +8.6% spread, 5.0-yr extensions (2026 tranche print) | FY2025 MD&A §6 |
| Occupancy | 98.1%, held flat; scenario variable | Q1 2026 MD&A §6 |
| Development completions (dated NOI steps) | H2'26: $54.9M @ 6.25–6.75%; H1'27: $17.9M @ 6.00–6.50%; H2'27: $288.8M @ 6.00–6.50% (841k sf unleased — lease-up assumption required) | Q1 2026 MD&A §3 pipeline table |
| Capitalized interest flip | $1.5M/qtr proportionate share currently capitalized at 4.28%, migrating to expense at completion | Q1 2026 statements Note 16 |
| Acquisitions / dispositions | $0 base; policy scale reference: FY2025 $459.8M / $341.0M | FY2025 MD&A §3.2 |
| Interest expense | A-1 debt schedule; marginal rate cell 4.60% (+100/+200 scenarios) | A-1 build; FY2025 Note 15/16 |
| Corporate & other (recurring) | Trust G&A (drag) · fee + interest/investment income (credit) · Allied distribution income (FVTPL stake — fair-value change reversed in FFO) — each its own row, held at run-rate | FY2025 statements; MD&A other income & G&A |
| Non-recurring items to normalize | Lease-surrender revenue etc. — strip from the seed quarter before annualizing (Q1 2026 carried $1.9M elevated) | Q1 2026 MD&A |
| Funding equation | Retained AFFO ~$76M/yr + dispositions − dev spend ($250.4M over 12–24 mo) → facility draw @ ~3.6% floating | Derived; Q1 2026 MD&A §4 |
| Units, fully diluted | 723.8M, flat; dilution module built, switches off (no DRIP; NCIB = comp only) | FY2025/Q1 2026 MD&A §4 |
| Distribution per unit | $0.78 p.a., +1.3% each March (policy pattern); payout monitors: FFO ~72%, AFFO ~88% | FY2025/Q1 2026 MD&A |
| Cap-rate mark (Reported NAV roll-forward) | Unchanged (6.02% WA overall); scenario: ±25 bps terminal = −$0.46/+$0.49 per unit | Q1 2026 MD&A §3.1; statements Note 5 |
| Non-property marks (Reported NAV roll-forward) | Allied FVTPL stake + other FVTPL/OCI — reversed out of FFO, so they hit equity directly (FY2025: ~−$0.12/unit Allied Q4 loss); default unchanged, own scenario cell | Q4 2025 statements; FVTPL / OCI notes |
| Covenant monitors | Adj. Debt/Assets ≤60% (40.9% actual); DSCR ≥1.5x (3.0x) | A-1; Q1 2026 MD&A §4.6 |
The illustrative FY2026 bridge the skeleton produces (base case, all scenario cells at default): FY2025 FFO/unit $1.069 → +$0.034 same-asset engine (+2.5% on $982.8M) → +~$0.003 development completions net of the interest flip (H2-weighted, partial-year) → −~$0.009 financing (Series Q's November roll, mortgage rolls, facility draws funding development) → ≈ $1.09–$1.10, against issuer guidance of $1.08–$1.10 and a Q1 2026 annualized pace of $1.084. The model and the issuer agree — which, per 2.6, is comfort, not proof.
Dated aside — the FCR scenario layer. Choice's agreement to acquire $5.0B of First Capital assets (announced April 2026, expected close H2 2026) is exactly what a scenario layer is for: a separate, switchable module. Into the dilution ledger it puts +68.6M trust units to FCR unitholders and a ~$0.6B unit subscription by GWL — and that dollar figure has to become a unit count before any per-unit math, or you add the NOI and the debt but not the shares and flatter every accretion number. At an assumed issue price near Reported NAV per unit ($14.4), the GWL subscription is ≈ +42M units ($0.6B ÷ ~$14.4), so the ledger takes roughly 111M new trust units, not 68.6M (swap in the disclosed subscription price once terms are final — the unit count moves inversely with it). Into the A-1 schedule the module puts +$2.3B of assumed FCR debentures and ~$0.4B of mortgages at their in-place coupons; into the transactions layer, +$4.8B of income-producing assets at an assumed cap rate — with the switch OFF in the base case, because the base models the REIT that exists, and guidance itself excludes the deal. Accretion math on the module is I-3's discipline at full scale: new NOI against all the new units and new interest, per unit, no shortcuts. When the deal closes, the module's assumptions get replaced with disclosed terms and the switch flips on. Until then it is a scenario — A-3 will run it as one.
The build: a three-year quarterly forecast for Choice (~60–90 min)
The capstone artifact of the first half of the track: a 12-quarter FFO / AFFO / Reported-NAV-per-unit forecast (Q2 2026 – Q1 2029), seeded with Q1 2026 actuals, every driver an assumption cell. Build it yourself — the worked FY2026 bridge and checkpoints below are your check; A-3 stresses what you build here.
Step 1 — Lay the four blocks on separate sheets or panels: same-property engine (quarterly, by segment if you're ambitious), transactions layer (the disclosed completion schedule as dated NOI steps, with a lease-up toggle on Caledon D), financing stack (import your A-1 schedule — instruments, coupons, maturities, marginal-rate cell), units & distributions (723.8M flat; dilution module with switches off; $0.78 growing +1.3% each March).
Step 2 — Wire the funding equation as a quarterly reconciliation row: development spend + acquisitions + amortization − retained AFFO − dispositions = Δ facility draw (positive = borrow to fund the gap, negative = surplus repays the facility), with the draw accruing interest at the floating rate and feeding back into FFO. Checkpoint 1: the facility balance stays positive and bounded; if it explodes, your development spend and retained cash are inconsistent.
Step 3 — Produce the per-unit outputs: quarterly FFO/unit, AFFO/unit (annual with seasonal profile — use the disclosed quarterly capex shape), and Reported NAV/unit rolled forward at unchanged marks (property and non-property). Checkpoint 2: your four 2026 quarters of FFO/unit should sum inside issuer guidance of $1.08–$1.10 without tuning. Checkpoint 3: your end-2026 Reported NAV/unit should land ≈ $14.75–$14.85 at flat marks ($14.53 + three quarters of retained FFO at ~$0.075/quarter + development creation) — materially higher means marks leaked into your roll-forward; materially lower means a term went missing.
Step 4 — Run the covenant monitors (A-1) across all 12 quarters: Adjusted Debt/Assets vs 60%, DSCR vs 1.5x. In the base case both should stay far from breach; the point is that the rows exist for A-3 to stress.
Step 5 — Back-test before you trust it. Point the model backwards: seed it with Q3 2024 information (the seven-quarter table gives you actuals), forecast the six quarters you already know, and attribute the misses to operations / financing / you. Write the attribution down. This page of your model is worth more than the forecast itself.
Step 6 — Build the FCR module (structure only): the three insertions from the worked example, one master switch, default OFF. Do not blend it into the base.
A note on what this build is not: it is not a valuation. You now have a machine that turns assumptions into per-unit paths — A-3 gives it scenarios to digest, A-4 scores the risks it surfaces, and A-5 judges the management decisions it prices. Resist the urge to bolt a price target onto it today.
Analyst callout — the traps in this course
Forecasting IFRS net income. The architecture error. Choice's net income swung from −$663M to +$792M in adjacent quarters while FFO/unit moved a cent and a half. Any model with a net-income row above the FFO reconciliation is forecasting appraisals and unit prices, not real estate.
Annualizing a noisy quarter. Q1 2026 FFO included $1.9M of elevated lease-surrender revenue and $3.2M lower Allied distributions vs prior year — reported growth +2.7%, underlying +3.5%. Normalize the seed quarter before multiplying anything by four. Both items live in the corporate & other bridge (2.4): lease-surrender is the non-recurring line you strip, the Allied distribution income the recurring line you carry forward at rate.
Quarterly AFFO without capex seasonality. Property capital ran $0.4M in Q1 2025 and $41.7M in Q3 2025. A flat quarterly sustaining-capex assumption manufactures fake AFFO volatility in your variance analysis — or worse, fake stability.
Yield-on-cost is not a lease. Caledon Building D: 841k sf, ~$0.2B of remaining pipeline value, unleased, sitting in the disclosed schedule at a 5.75–6.25% target yield. Book the NOI on a lease-up assumption you chose consciously, not on the issuer's timetable.
The capitalized-interest flip. Every completion adds NOI and stops capitalizing its interest. Modelling the first without the second overstates development accretion project after project — the forecast version of I-2's species #3.
Guidance anchoring. Tuning assumptions until the model matches $1.08–$1.10 validates nothing — guidance is the issuer's forecast, made with better information and stronger incentives. Match it independently or investigate the gap; never aim at it.
The undisclosed escalator. Choice never quantifies its contractual rent steps; your ~2-point escalator assumption is an inference from the same-asset residual. Inferences are fine — unlabelled inferences are how models acquire false precision.
Key terms
| Term | Definition |
|---|---|
| Same-asset (same-property) pool | Properties owned and operated across both comparison periods; the issuer-defined perimeter of organic growth (I-5), and the model's first block. |
| Transactions NOI | NOI from assets outside the same-asset pool — acquisitions, dispositions, developments; the issuer's own disclosure of the model's second block. |
| Expiry ladder | Leased area and expiring rent scheduled by year; bounds the roll's contribution to any year's growth. |
| First-year vs long-term spread | Renewal rate uplift measured in year one vs averaged over the renewal term; use first-year for near-term NOI, long-term for value. |
| Escalator inference | Estimating undisclosed contractual rent steps as the residual of the same-asset bridge; legitimate, provided it is labelled. |
| Forecast decay | The shift of forecast content from contract to assumption as the horizon extends; implemented as scenario cells replacing point estimates in outer years. |
| Funding equation | The quarterly reconciliation of retained cash, disposals, and capital spend to facility draws or issuance; where model inconsistency surfaces. |
| Dilution module | The projected unit-count machinery (DRIP, issuance, unit comp, NCIB) — built even when every switch is off (I-3, projected). |
| Distribution policy constraint | Modelling distributions as observed policy and reading implied payout ratios as outputs; payout >100% is a finding, not a forecast. |
| Reported NAV roll-forward | Reported NAV(t) + retained FFO − non-mark FFO add-backs (transaction costs, deferred tax) + development value creation ± property cap-rate marks ± non-property (FVTPL/OCI) marks — the bridge from the FFO forecast to the Reported NAV forecast (per-unit at a constant unit count; roll total equity through sources and uses once units change). |
| Retained FFO | FFO less distributions declared — the manufactured, forecastable term of Reported NAV growth. Not retained AFFO: AFFO's sustaining-capex and straight-line-rent deductions are cash-timing/non-cash items that don't reduce IFRS equity, so retained AFFO is the cash figure the funding equation uses, not the equity-growth term. |
| Yield-on-cost spread | Development yield minus the market cap rate; the source of manufactured Reported NAV (7.4% into 6.04%, FY2025). |
| Capitalized-interest flip | The migration of a project's interest from capitalized (invisible to FFO) to expensed at completion. |
| Back-testing | Running the model against known history with as-of information; the price of admission for trusting any forward output. |
| Error attribution | Assigning forecast misses to operations, financing, or analyst override — the third bin kept in writing. |
| Scenario layer / module | A switchable block modelling a discrete event (the FCR transaction) kept out of the base case until terms are real. |
Knowledge check
1. Choice's net income across seven quarters spans −$663M to +$792M; FFO per unit spans $0.255 to $0.278. What architectural rule does this pair of facts impose, and why is the volatility difference structural rather than coincidental?
The model must be NOI-driven with net income appearing nowhere. The volatility difference is structural: net income under fair-value IFRS embeds IAS 40 property marks and the IAS 32 exchangeable-unit remeasurement — both functions of market prices, which are unforecastable — while FFO strips precisely those items, leaving contractual rent, operating costs, and interest. The seven-quarter table is the empirical proof of what I-2 established definitionally: the volatile component of net income is exactly the part FFO exists to remove, so forecasting net income means forecasting the noise.
2. Choice guides to 2–3% same-asset cash NOI growth for 2026. Only 3.15% of in-place rent expires in 2026, and first-year renewal spreads ran +12%. Decompose the guidance and state what the decomposition implies about forecast confidence.
The roll contributes 3.15% × 12% ≈ 0.38 points annualized — but only ~0.19 points to FY2026 itself, because the renewals land through the year (even-timing/half-year assumption; use the ladder's disclosed renewal dates to sharpen it). The remaining ~1.8–2.8 points must come from the rest of cash NOI — contractual escalators, occupancy, and the expense/recovery side — none itemized, so the escalator estimate is an inferred residual and only an upper bound on the contractual piece (some of it is recovery-ratio and operating-cost movement, not steps). The implication: much of 2026 growth is contractual and so relatively forecastable — even a collapse in leasing spreads to zero would cost only ~0.2 points in FY2026 (~0.4 annualized) — but because the residual folds in less-contractual expense items, don't overstate the confidence. The roll component is unusually forecastable and its upside capped; the expense line is where the remaining variance hides.
3. Choice's H2 2027 pipeline shows $288.8M of industrial completions at a 6.00–6.50% target yield (~$18M annualized NOI). What three adjustments must the model make before that $18M reaches FFO per unit?
First, a lease-up assumption: 841k sf (Caledon D) is unleased — the yield is a target, so the NOI needs a probability, lag, or haircut chosen by the analyst. Second, the capitalized-interest flip: at completion, the project's interest stops being capitalized and starts hitting interest expense, offsetting part of the NOI gain. Third, the funding cost: the remaining ~$250M of construction spend is financed through the funding equation (retained AFFO, dispositions, facility draws at floating rates), and that interest belongs in the same forecast quarters. Only the net of all three, divided by 723.8M units, is accretion (I-3).
4. Decompose Choice's FY2025 Reported NAV-per-unit growth of $0.36 (from $14.07 to $14.43) using the roll-forward, and explain which terms a forecaster may legitimately project.
Retained FFO contributed ~$0.30 (FFO $773.7M − distributions $556.1M = $217.6M), development completion gains ~$0.065 ($46.9M), and the marks netted roughly flat — but as a net, not one quiet line: the Allied FVTPL stake took a ~−$0.12/unit Q4 2025 mark-to-market loss (reversed out of FFO, straight into equity) that the property cap-rate mark offset, so the residual is two marks cancelling. The first two terms are manufactured — they fall out of the model's own FFO and development rows and may be projected with the same confidence as those rows. Use retained FFO, not retained AFFO: AFFO's sustaining-capex and straight-line-rent deductions are cash-timing/non-cash items that don't reduce IFRS equity, so folding them in would understate the operating term and spuriously inflate the marks residual. Both marks terms — property cap-rate and non-property (FVTPL/OCI) — are scenario inputs, not forecasts: the analyst has no edge predicting appraisal moves or where an equity stake re-rates, so default each to zero and expose them to A-3's scenarios (cap-rate ±25 bps ≈ ∓$0.46–0.49/unit).
5. Choice's unit count has been frozen at 723.8M for five quarters, with no DRIP and an NCIB used only for compensation. Why does the build still require a full dilution module — and what, concretely, would flip its switches on?
Because the model is the machine, not this REIT's instance of it: the module's rows (DRIP take-up, issuance, unit-settled comp, buybacks) are structural, and Choice merely sets them to zero — the next REIT won't. Concretely, Choice's own switches flip if the FCR transaction closes: ~68.6M trust units to FCR unitholders and a ~$0.6B GWL subscription (≈ +42M units at an assumed ~$14.4 issue price — roughly 111M new units in total) enter the ledger, alongside $2.3B of assumed debentures in the A-1 schedule and $4.8B of assets in the transactions layer. That is why the FCR module is built with structure today and a switch set OFF — the base case models the REIT that exists, and the event flips a switch instead of forcing a rebuild.
Sources: Choice Properties REIT FY2025 audited consolidated financial statements and annual MD&A (year ended December 31, 2025) and Q1 2026 interim statements and MD&A (three months ended March 31, 2026) — same-asset NOI and segment disclosure (MD&A §7.2), operating metrics and expiry ladder (§6), development pipeline (§3), Reported NAV and valuation metrics (§3.1, §4.10/4.9; statements fair-value sensitivity note), quarterly history (Selected Quarterly Information), 2026 outlook (§14/§13); REALPAC, FFO & AFFO for IFRS White Paper (January 2022). The escalator estimate, FY2026 bridge, Reported NAV decomposition, and all model outputs are analyst calculations from disclosed inputs, shown in full; the 2–3% growth and $1.08–$1.10 guidance are the issuer's targets, which explicitly exclude the pending FCR transaction. All figures C$, as at the stated reporting dates; refresh the dated assumption block from each new quarter's filings without touching the structure.
Previous: Course A-1 — The Liability Stack. Next in the track: Course A-3 — Scenario Analysis and Stress Testing.