Level: Intermediate · Duration: ~15 minutes · Course 6 of 6 in the Intermediate track
Prerequisites: the entire Intermediate track. This capstone uses the restatement recipe from I-2, the unit census from I-3, the Real Estate NAV and implied-cap-rate machinery from I-4, and the pool audit from I-5. If any of those felt shaky, revisit them first — this course assumes them the way arithmetic assumes counting.
By the end of this course you will be able to:
- Assemble a defensible comparable set and articulate why each member belongs
- Run the full normalization pass so that every number in your table means the same thing in every column
- Build the ten-row comp table that carries a REIT comparison, and defend each row's inclusion
- Decompose a valuation gap into definition artifacts, structural discounts, and genuine mispricing
- Know precisely what a comp table cannot tell you — and what work remains after it
A comp table is the most abused artifact in REIT analysis: easy to build badly in ten minutes from screener data, and wrong in every cell for reasons this track has now equipped you to name. Built properly, it is the closest thing the discipline has to a complete argument on one page.
6.1 Choosing the comp set
A comparable set earns its name from shared economics, not shared index membership. The screening dimensions, in descending order of importance: property type and format (grocery-anchored retail is not enclosed-mall retail is not street retail), geography (a GTA-weighted portfolio and a Western-Canada-weighted one live in different economies), size and liquidity, and structure — related-party anchor tenancy, exchangeable-unit overhangs, internal versus external management.
Our worked set is Canadian grocery-and-necessity-anchored retail:
Choice Properties (CHP.UN). The track's running example. Loblaw as anchor tenant across the majority of the portfolio; George Weston Limited holding a majority effective interest largely through exchangeable Class B LP units; a meaningful industrial allocation alongside the retail core.
CT REIT (CRT.UN). The purest sponsor-REIT in the country: Canadian Tire Corporation is both majority unitholder (via an exchangeable-unit structure directly analogous to Choice's) and the tenant behind the large majority of base rent — historically above nine-tenths (verify the current figure in the AIF before publishing). Very long WALT, near-full occupancy, contractual escalators doing most of the growth work. Economically, something close to a Canadian Tire credit instrument wrapped around a real estate portfolio.
First Capital REIT (FCR.UN). The structural control: grocery-anchored like the others, but independent — no sponsor, no dominant tenant (largest tenants in the single digits of rent), internally managed, urban-intensification strategy with a significant development pipeline, and no exchangeable-unit class distorting the accounts.
This trio is chosen because it differs on structure while matching on property economics. That is what makes divergence interpretable: when Choice and CT diverge from First Capital, structure is the first suspect; when Choice diverges from CT, structure is largely controlled and the explanation lives in portfolio or management.
6.2 The normalization pass
Every course in this track was secretly building this checklist. Before a single ratio is computed, run each column through it:
| Dimension | What differs between issuers | Fix (and course) |
|---|---|---|
| FFO/AFFO definition | Non-standard add-backs, sustaining-capex philosophy (reserve vs actual), capitalization practices | Restate both to REALPAC from net income; impose a common sustaining reserve (I-2) |
| Unit count | Exchangeables (Choice, CT) absent from screener data; different dilution conventions | Fully exchanged basis everywhere, from the unit notes (I-3) |
| Equity & market cap | IFRS equity excludes exchangeable liability at two of three names | Adjusted book equity; market cap on fully exchanged count (I-3, I-4) |
| Valuation basis | Reported NAV vs Real Estate NAV vs different cap-rate vintages | One basis for the whole row — ideally your Real Estate NAV per I-4, same-date marks |
| Leverage & coverage | Exchangeable liability in/out of debt; fair value vs face; issuer-specific EBITDA definitions | Exchangeables out of debt, distributions out of interest; one debt/GBV recipe (I-3, Beginner 6) |
| SPNOI | Pool definitions, coverage ratios, cash vs IFRS basis | Check pool coverage & stability; prefer cash basis; footnote any pool concerns (I-5) |
The discipline that matters: a number enters the table only after it means the same thing in every column. A table that mixes Choice's issuer-defined AFFO with your restated First Capital AFFO is not conservative — it is wrong in a direction you haven't bothered to determine.
6.3 The table
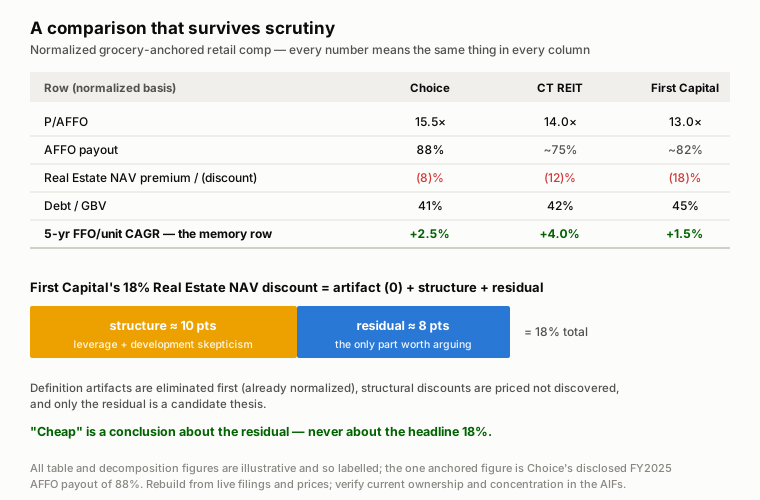
Ten rows carry the argument. All figures below are illustrative — the table demonstrates form and interpretation, not current data. Rebuild from live filings and prices; the one anchored figure is Choice's disclosed FY2025 AFFO payout of 88%.
| Row (normalized basis) | Choice | CT REIT | First Capital | Why the row exists |
|---|---|---|---|---|
| P/AFFO | 15.5× | 14.0× | 13.0× | The valuation headline — on restated AFFO only |
| AFFO payout | 88% | ~75% | ~82% | Distribution safety (Beginner 5), post-restatement |
| Real Estate NAV premium/(discount) | (8)% | (12)% | (18)% | Price vs your Real Estate NAV — one Real Estate NAV recipe for all three |
| Implied vs disclosed cap rate | +35 bps | +45 bps | +50 bps | The market's skepticism about the marks, per name (I-4) |
| Debt/GBV | 41% | 42% | 45% | Balance-sheet risk, common definition |
| Interest coverage | 3.4× | 3.3× | 2.9× | Cushion; exchangeable distributions excluded (I-3) |
| SPNOI growth (cash) | +2.8% | +2.2% | +3.5% | The operating engine (I-5), pool-audited |
| 5-yr FFO/unit CAGR | +2.5% | +4.0% | +1.5% | Capital discipline across a cycle (I-3) — the memory row |
| WALT / occupancy | 5.8y / 98% | 8.5y / 99% | 4.5y / 96% | Income duration and repricing speed (I-5) |
| Top-tenant concentration | Loblaw, majority of rent | Canadian Tire, large majority | Largest ~10% | The credit question hiding inside the real estate |
Three reading habits for any such table:
Read columns before rows. Each column should cohere as a machine: CT's long WALT + near-full occupancy + modest SPNOI + high concentration is one consistent machine (a bond-like sponsor REIT); First Capital's short WALT + faster SPNOI + development pipeline + higher leverage is another (an urban compounder paying for its optionality). A column that doesn't cohere — say, bond-like operating metrics with a growth-REIT payout ratio — is either an error in your build or the beginning of a thesis.
Read the memory row hardest. Almost everything in the table is a snapshot. The 5-year per-unit CAGR is the only row that remembers how management behaved across a cycle — every bought deal below Real Estate NAV, every well-timed disposition, compounded. Illustratively here, CT's 4.0% against First Capital's 1.5% despite First Capital's better SPNOI is exactly the kind of tension the row exists to surface: operations are only one input to per-unit outcomes; capital allocation is the other (I-3's central lesson).
Read nothing in isolation. First Capital's 13.0× is not "cheapest" until the next section says so.
6.4 Interpreting divergence: artifact, structure, or signal?
A valuation gap in the table has exactly three possible sources, and they must be eliminated in order:
1. Definition artifacts — eliminate first. If you skipped the normalization pass, stop: an 88% payout against a 75% may be two sustaining-capex philosophies, not two risk profiles; a "cheap" P/AFFO may be a screener unit-count error (I-3) worth 40 points of multiple. Only a fully normalized table has earned interpretation. (In our illustrative table this step is done — by construction.)
2. Structural discounts — price them, don't discover them. Persistent, rational features the market correctly charges for:
- Concentration: CT's rent is substantially a single retail credit. That deserves a structurally wider cap rate than a diversified rent roll — the question is never whether but how many basis points, and the corporate bond market's pricing of Canadian Tire credit gives you an external anchor for the answer.
- Sponsor control: majority unitholders (GWL, Canadian Tire) decide strategy, and conflicts are managed, not absent. A control discount is rational; its size is debatable.
- Leverage and duration: First Capital's higher debt/GBV amplifies its Real Estate NAV sensitivity (I-4's ÷0.55 arithmetic) — some of its wider Real Estate NAV discount is just levered risk, correctly priced.
3. Genuine mispricing — what remains. Only the residual after artifacts and structure is a candidate thesis. Illustratively: if First Capital's 18% Real Estate NAV discount decomposes into ~5 points of leverage charge and ~5 of development-execution skepticism, the contestable residual is ~8 points — and your I-4 staleness tests plus your view on the development pipeline tell you whether to contest it. Write the decomposition down in that form: discount = artifact + structure + residual. It converts "looks cheap" — the least useful sentence in finance — into an argument with named, sized, attackable parts.
6.5 What the table cannot tell you
The honest coda every capstone needs. A normalized comp table still cannot see: management quality beyond the per-unit CAGR's rear-view evidence; development execution risk (First Capital's pipeline is upside in the Real Estate NAV and a construction-cost problem in reality — the table holds both as one number); refinancing cliffs inside the debt ladder (the maturity schedule matters, not just the ratio — Course I-1's first pass); tenant health beyond concentration percentages; and anything about the future of the assets themselves — which is what the Sector Guides track exists to teach.
The comp table is where intermediate analysis ends: everything measurable, normalized, and compared. The Advanced track begins where the table's silence starts — scenario analysis, stress testing, and portfolio construction on top of these foundations.
You now have the complete intermediate toolkit: find anything in a filing (I-1), rebuild the earnings measures (I-2), get every denominator right (I-3), form your own view of asset value (I-4), judge the operating engine (I-5), and assemble it all into a comparison that survives scrutiny (I-6). That is, in miniature, the working method of a professional REIT analyst.
Analyst callout — the traps in this course
The ten-minute screener comp. Issuer-defined AFFO, listed-units-only market caps, mixed valuation vintages (stale Reported NAV against fresh) — every error this track has catalogued, assembled into one confident-looking exhibit. The most dangerous artifact in the sector because it looks identical to the real thing.
Mixed bases within a row. One issuer's Reported NAV next to your Real Estate NAV for another is not a comparison; it is two different questions pretending to share a row. One recipe per row, always.
Single-period operating rows. One quarter's SPNOI comparison is mostly noise and one-offs (I-5's bridge). Use trailing-year figures, and let the 5-year per-unit row carry the weight of history.
Skipping the decomposition. A discount you haven't split into artifact/structure/residual is not a finding — it is a temptation. The market prices concentration, control, and leverage all day; assume it has, then argue with the residual.
False precision. Restated figures inherit your assumptions (common capex reserve, your cap rates). Present comparisons to the half-turn and the percentage point, not the basis point — and show the bridge so readers can move your assumptions and watch the table move.
Key terms
| Term | Definition |
|---|---|
| Comparable set | Peers matched on property economics (type, format, geography) so residual differences are interpretable. |
| Normalization pass | Restating every input — earnings, units, valuation basis, leverage — to common definitions (one NAV variant, one AFFO recipe) before comparison. |
| Sponsor REIT | REIT with a controlling corporate unitholder that is typically also the anchor tenant (CT REIT, Choice); brings credit-like income and control/concentration discounts. |
| Structural discount | Persistent, rational valuation charge for concentration, control, leverage, or liquidity — to be sized, not "discovered" as mispricing. |
| Decomposition (of a gap) | Splitting a valuation gap into definition artifact + structural discount + residual; only the residual is a thesis. |
| Memory row | The multi-year per-unit CAGR — the one comp-table row that records capital-allocation behavior across a cycle. |
| Implied-vs-disclosed spread | Gap between market-implied and disclosed cap rates per name (I-4); the market's mark-skepticism, comparable across a peer set. |
| Coverage (of SPNOI pool) | Same-property NOI as a share of total NOI; a pool-quality test that must pass before the SPNOI row is trusted (I-5). |
| Column coherence | The test that each REIT's metrics describe one consistent economic machine; incoherence flags an error or a thesis. |
| Residual | What remains of a valuation gap after artifacts and structure are removed — the only part worth arguing about. |
Knowledge check
1. Why is First Capital in this comp set at all, given it lacks the sponsor structure of the other two?
Deliberately — it is the structural control. All three match on property economics (grocery-anchored Canadian retail), so First Capital's independence isolates the effect of sponsor structure: when Choice and CT diverge from FCR, structure is the leading suspect; when Choice diverges from CT, structure is controlled and the explanation must lie in portfolio, leverage, or management. A comp set of three identical structures would match better and explain less.
2. Your screener shows CT REIT at a far lower P/FFO than this table suggests. Reconstruct the likely error chain.
Screener market cap uses listed trust units only; CT's majority holder sits in unlisted exchangeable Class B units, so the numerator (market cap) is missing most of the equity claim. If FFO in the denominator is the issuer's disclosed figure (which adds back exchangeable distributions and uses the fully exchanged count), the multiple mixes a trust-units-only numerator with a fully exchanged denominator — the I-3 mismatch, worth roughly a halving of the apparent multiple. Every sponsor REIT looks artificially cheap on raw vendor data.
3. CT REIT shows the slowest SPNOI growth (+2.2% illustrative) yet the best 5-year FFO/unit CAGR (+4.0% illustrative). Reconcile.
SPNOI measures the existing assets; per-unit CAGR compounds operations plus capital allocation. A REIT with modest organic growth but disciplined capital behavior — development at yields above its cost of capital, minimal issuance below Real Estate NAV, steady escalator-driven income — can out-compound a faster-operating peer that dilutes. The tension between these two rows is not a contradiction; it is the comp table pointing at capital discipline as the differentiator to investigate.
4. First Capital trades at an 18% discount to your Real Estate NAV (illustrative). Walk the decomposition before you call it cheap.
First, artifacts: the Real Estate NAV is your own recipe, applied identically to all three — so definitional noise is already out. Next, structure: size the leverage charge (45% debt/GBV amplifies Real Estate NAV sensitivity — I-4 math converts that to extra required discount) and the market's rational skepticism of development pipelines. If those absorb, say, ten points, the residual is ~8 points. Only then apply judgment: do your staleness tests support the marks? Is the development skepticism excessive given execution history? "Cheap" is a conclusion about the residual, never about the headline 18%.
5. Name three questions this comp table cannot answer, and where in the curriculum each one lives.
Whether a refinancing wall lurks inside the debt ratios — the maturity ladder, Course I-1's first pass and the Advanced track's stress testing. Whether the sector's economics will still support these rents in ten years — the Sector Guides track. Whether management will allocate the next billion well — partially visible in the memory row, truly answerable only through the Advanced track's frameworks and, ultimately, judgment the curriculum can inform but not replace.
Sources: Structural facts (ownership, anchor-tenant relationships, management structure) from the issuers' AIFs and annual filings — verify current concentration and ownership percentages before publication. Choice Properties FY2025 AFFO payout (88%) as disclosed; all other table figures are illustrative and so labelled. REALPAC FFO & AFFO for IFRS White Paper (January 2022); CSA NI 52-112.
Previous: Course I-5 — Same-Property NOI and the Operating Engine. This completes the Intermediate track. Next: the Advanced track (scenario analysis, risk frameworks, portfolio construction) and Sector Guides.