Level: Intermediate · Duration: ~15 minutes · Course 5 of 6 in the Intermediate track
Prerequisites: Beginner Course 3 (FFO/AFFO) and Course I-1 (the MD&A as home of non-GAAP measures). Courses I-2 through I-4 taught you to clean up the accounting; this course finally asks whether the underlying real estate is any good.
By the end of this course you will be able to:
- Define same-property NOI precisely and audit an issuer's same-property pool for massage
- Distinguish cash from IFRS same-property NOI and know when each is the right lens
- Read the four operating metrics that drive NOI — occupancy, leasing spreads, retention, WALT — including their definitional traps
- Apply sector-specific standards for what "good" looks like in retail, industrial, apartments, and office
- Decompose a period's NOI growth into escalators, spreads, occupancy, and noise — and separate organic growth from bought growth
Everything before this course could, in principle, be done by an accountant who has never seen a building. This course is where real estate analysis becomes about real estate.
5.1 Same-property NOI: the concept, and the pool that defines it
Total NOI growth is a nearly useless number. A REIT that bought $500M of buildings last year will show NOI growth even if every asset it owns is deteriorating; a REIT that sold assets will show shrinkage even if every remaining building is thriving. Same-property NOI (SPNOI) — sometimes "same-asset" or "same-store" — fixes this by comparing NOI only for properties owned and operating throughout both periods being compared. It is the sector's answer to the question: is the existing portfolio organically growing?
SPNOI is non-GAAP, which after Course I-1 should trigger a reflex: who defines the pool, and how? The issuer does, and the pool definition is where the measure can be quietly shaped:
Exclusions into "redevelopment." A property pulled from the pool because it is "undergoing redevelopment" no longer drags on SPNOI. Sometimes legitimate — a building under active construction isn't informative about run-rate operations. But watch for assets that enter "redevelopment" when occupancy sags and re-enter the pool once stabilized: heads-I-win pool management. The MD&A discloses the pool's property count and GLA; track both across quarters. A pool that persistently sheds its weakest members is a filtered sample, and its growth rate is an overstatement of the portfolio's true organic trend.
Inclusion timing. How long after acquisition or development completion does an asset join the pool? Standard practice is once owned for the full comparative period. An issuer that fast-tracks a recently stabilized development (still in its lease-up honeymoon) into the pool imports growth that won't repeat.
The coverage check. Divide same-property NOI by total NOI. A pool covering 90%+ of the portfolio speaks for the REIT; a pool covering 70% leaves nearly a third of the assets unexamined by the headline organic-growth number — and the excluded third is rarely the strong third. Low or falling coverage is a finding in itself.
5.2 Cash vs IFRS same-property NOI
Straight-line rent — Course I-2's non-cash revenue from averaging contractual rent steps — contaminates SPNOI exactly as it contaminates FFO. Many issuers therefore disclose both an IFRS-basis and a cash-basis SPNOI (straight-line rent and certain lease-accounting items removed).
The lenses answer different questions. IFRS-basis reflects the contractual earning trajectory; cash-basis reflects what the buildings collected. The divergences are informative in both directions:
- Cash growing faster than IFRS: older leases are moving through their escalation schedules toward expiry — contractual rent steps already recognized are now being collected. Neutral-to-fine.
- IFRS growing faster than cash, persistently: growth is being booked ahead of being collected — long leases with big back-loaded steps, or free-rent periods being smoothed. Not improper, but a growth rate the tenant hasn't paid yet. Prefer the cash lens when assessing distribution coverage; note the gap when it exceeds a point or two.
When only one basis is disclosed, know which you are reading — the MD&A's definition section (NI 52-112 again) will say.
5.3 The four dials on the operating engine
SPNOI is an output. Four disclosed metrics are the inputs that move it, and each carries a definitional trap:
Occupancy. The trap is which occupancy: in-place (tenant paying rent today) versus committed (leases signed, including tenants not yet in occupancy or paying). Committed occupancy runs one to several points higher and is the number issuers prefer to headline. Both are legitimate; trend them separately. A widening gap between committed and in-place means signed deals aren't converting to rent yet — fine briefly, notable if persistent. Note also economic vs physical nuances where disclosed: a tenant in a free-rent period is physically present and economically absent.
Leasing spreads. The percentage change between the rent on a new or renewed lease and the expiring rent on the same space — the purest read on whether the portfolio's rents sit below or above market. Traps: spreads are usually quoted on net rents for renewals excluding the effect of tenant improvements and inducements paid to win the deal (a +15% spread purchased with a year of free rent and heavy TI is far weaker than it looks — cross-check leasing costs in the AFFO deductions, Course I-2); and blended averages can hide a strong renewal spread masking weak new-lease pricing, or vice versa. Look for the disclosure split.
Retention. Share of expiring GLA renewed. High retention compounds quietly: every point of retention is space that needs no downtime, no TI package, and no commission. Low retention makes leasing spreads more important — the REIT is repricing more of its space at market — for better or worse.
WALT (weighted-average lease term). Duration of the income stream. Long WALT (grocery-anchored retail, single-tenant industrial) means stability and slow mark-to-market; short WALT (apartments at one year, self-storage at one month) means the portfolio repricing to market rents almost continuously. Neither is better — they are different machines, which is the subject of the next section.
5.4 What "good" looks like, by sector
The same SPNOI print means different things in different sectors, because the repricing machinery differs. Calibration, not commandments — typical ranges are market-dependent; date-stamp any you publish:
Grocery-anchored retail (Choice's world). Long leases, contractual escalators of roughly 1–2%, high retention. SPNOI growth of 2–3% is the machine working as designed; a 5% print should make you look for one-offs (a recovery true-up, a lease-termination fee — see the traps box) rather than celebrate. The anchor tenant's covenant matters more than any quarter's growth.
Industrial. The past decade's star: e-commerce demand against scarce urban land meant market rents far above in-place rents, so every expiry repriced dramatically — double-digit leasing spreads and 5%+ SPNOI growth became normal. The intermediate insight: that growth is a function of the gap between in-place and market rent, which is disclosed or estimable. A shrinking gap forecasts decelerating SPNOI years in advance, whatever today's print says.
Apartments (multi-family). One-year leases mean constant repricing, but in rent-controlled provinces the machine has two speeds: capped increases on sitting tenants, full mark-to-market on turnover. So the disclosed turnover spread (new vs prior rent on turned suites) times the turnover rate is the organic growth engine. Paradox worth teaching: falling turnover in a hot rental market can suppress near-term SPNOI growth while storing it — the mark-to-market potential accumulates in the loss-to-lease. Immigration-driven demand (a structural Canadian theme) works through exactly this channel.
Office. Read SPNOI growth alongside occupancy level and the sublease overhang. A positive SPNOI print on 85% occupancy with rising sublease availability is a weaker fact than a flat print on 95% occupancy. Utilization-versus-occupancy — tenants paying for space they don't fill — is the slow-burning risk: it shows up not in today's SPNOI but in renewal probabilities years out.
5.5 Decomposing the growth: the bridge
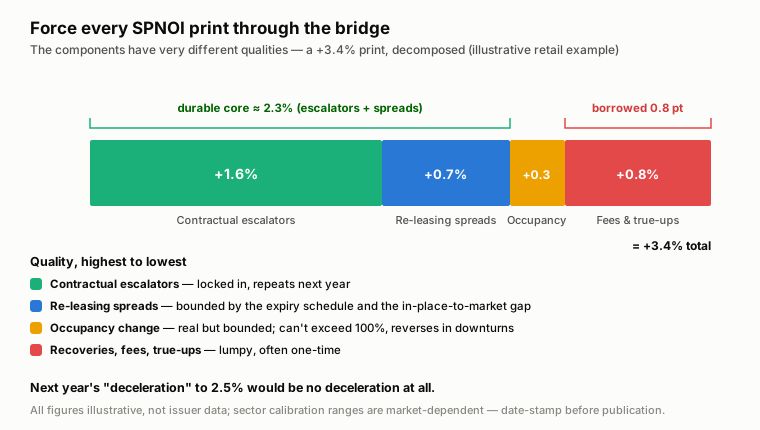
The MD&A typically narrates why SPNOI grew; better issuers table it. Either way, force every SPNOI print through this decomposition — the components have very different qualities:
| Component | Source | Quality |
|---|---|---|
| Contractual escalators | Existing leases' rent steps | Highest — locked, repeats next year |
| Re-leasing spreads | Expiries repriced to market | High — but limited by expiry schedule and the in-place/market gap |
| Occupancy change | Space filled or vacated | Real but bounded — can't exceed 100%, reverses in downturns |
| Recoveries, fees, other | Expense true-ups, termination fees, parking | Lowest — lumpy, often one-time |
Illustrative worked example (not issuer data). A retail REIT prints +3.4% SPNOI growth on a $400M same-property NOI base (+$13.6M). The MD&A narrative and your reading of the notes attribute: escalators +1.6% ($6.4M), renewal spreads +0.7% ($2.8M), occupancy +0.3% ($1.2M), lease-termination fees and recovery true-ups +0.8% ($3.2M). Analysis: the durable core is ~2.3% (escalators + spreads) — respectable for the sector; the headline 3.4% borrows 0.8 points from items that won't repeat. Next year's "deceleration" to 2.5% would be no deceleration at all. You have just insulated yourself against both the bull and bear misreadings of one quarter's print.
Last: organic vs bought growth at the REIT level. Total NOI growth minus the pool-weighted same-property contribution — SPNOI growth scaled by the prior-period pool's share of total NOI — ≈ the contribution from net acquisitions, completed developments, and dispositions. Subtracting the two raw percentages only works when the same-property pool is near 100% of NOI; when coverage is well below that (the 70%-pool case from the coverage check above), the percentages sit on different denominators, so weight first and net out dispositions and other scope changes before trusting the residual. A REIT compounding total NOI at 8% on 2% SPNOI is an acquisition machine — nothing wrong with that, but its growth costs capital (and units — Course I-3's dilution ledger) and lives or dies on acquisition spreads, not operations. A REIT growing 4% with 3.5% from same-property is an operating machine. The market pays different multiples for the two, and it is right to.
Analyst callout — the traps in this course
The migrating pool. Compare the same-property pool's GLA and property count to last year's disclosure of the same quarter. Assets slipping in and out — especially the correlation of exits with weak performance — is the sector's most common cosmetic device.
Termination fees dressed as growth. A tenant paying to break its lease produces a one-quarter NOI spike and a future vacancy. If SPNOI growth beats its own trend by more than a point, hunt the narrative for fee income before extrapolating.
Committed occupancy in the headline, in-place in the footnote. Always identify which basis a disclosed occupancy uses, and trend both. The gap is a leading indicator in both directions.
Spreads without their cost. A fat renewal spread bought with heavy TI and free rent is partially an investment being booked as operating growth. Cross-reference the leasing-cost line in the AFFO build (Course I-2) — if spreads and leasing costs are rising together, discount the spreads.
Extrapolating industrial-style spreads. Re-leasing growth is fuel from a tank — the in-place-to-market gap. Always estimate what's left in the tank before projecting the recent burn rate forward.
Key terms
| Term | Definition |
|---|---|
| Same-property NOI (SPNOI) | NOI from assets owned and operating throughout both comparison periods; the organic-growth measure. Non-GAAP — the pool is issuer-defined. |
| Same-property pool | The set of assets inside the SPNOI calculation; its coverage of total NOI and its stability across periods are quality tests. |
| Cash-basis SPNOI | SPNOI excluding straight-line rent and similar non-cash lease items; the collections lens. |
| In-place occupancy | Space with tenants paying rent today. |
| Committed occupancy | In-place plus signed-but-not-yet-paying leases; runs higher, headlines often. |
| Leasing spread | Rent change on new/renewed leases vs expiring rent on the same space; the mark-to-market read. |
| Retention | Percentage of expiring GLA renewed; high retention avoids downtime, TI, and commissions. |
| WALT | Weighted-average lease term; the duration of the income stream and the speed of its repricing. |
| Turnover spread | Apartments: rent change achieved on suites that turned over; with turnover rate, the engine of rent-controlled-market growth. |
| Loss-to-lease | Gap between in-place rents and market rents across a portfolio; stored future growth (or, if negative, stored pain). |
Knowledge check
1. A REIT reports +4.1% SPNOI growth, but its same-property pool covers 72% of total NOI, down from 86% two years ago, with several underperforming assets moved to "redevelopment." How do you treat the print?
As an upper bound, not a measurement. The pool has been filtered — falling coverage plus exit of weak assets means the +4.1% describes an increasingly curated sample. Rebuild intuition from the total portfolio: trend total NOI against acquisitions/dispositions, and check whether "redevelopment" assets have actual construction activity (capex disclosure) or merely weak occupancy.
2. IFRS-basis SPNOI grew 3.8%; cash-basis grew 1.9%, and the gap has persisted for six quarters. What is happening and which number belongs in a distribution-coverage discussion?
Growth is being recognized ahead of collection — consistent with long leases carrying back-loaded escalations or significant free-rent smoothing. Legitimate accounting, but the tenants haven't paid the growth yet. Cash-basis belongs in any distribution-coverage argument; the persistent gap itself belongs on the watch list.
3. An apartment REIT in a rent-controlled province reports decelerating SPNOI growth while market rents in its cities are rising strongly. Construct the benign explanation and the metric that confirms it.
Falling turnover: sitting tenants (capped increases) are staying put precisely because market rents are high, so fewer suites mark to market each year. The growth isn't lost — it accumulates as loss-to-lease. Confirm with the disclosed turnover rate falling while the turnover spread stays wide. The bearish alternative (demand weakness) would show narrowing turnover spreads instead.
4. In the worked bridge (+3.4% total: 1.6 escalators, 0.7 spreads, 0.3 occupancy, 0.8 fees/true-ups), management guides "similar growth next year." What is the right analytical challenge?
The repeatable core is ~2.3–2.6% (escalators lock in; spreads depend on the expiry schedule and rent gap; occupancy gains may hold). The 0.8 points of fees and true-ups have no reason to recur. Guidance of ~3.4% therefore implicitly assumes new one-offs or acceleration elsewhere — ask which, and press on the expiry schedule and in-place-to-market gap.
5. Two REITs both grew total NOI 7%. REIT A: SPNOI +3.5%, few acquisitions. REIT B: SPNOI +1.0%, heavy acquisition volume funded partly with units. What further analysis does each demand?
REIT A's growth is operational — verify durability via the 5.5 bridge and the sector machinery (expiry schedule, spreads). REIT B's growth is bought — so the questions move to capital discipline: acquisition cap rates vs cost of capital, and above all per-unit outcomes (Course I-3): did FFO and Reported NAV per unit grow, or just the REIT? Same headline, entirely different investment theses.
Sources: REALPAC guidance on NOI-based measures; CSA National Instrument 52-112 (definition and consistency requirements applicable to SPNOI as a non-GAAP measure). The 5.5 bridge and all figures in this course are illustrative, not issuer data; sector calibration ranges reflect typical Canadian conditions and are market-dependent — date-stamp before publication.
Previous: Course I-4 — Interrogating Fair Value. Next in the track: Course I-6 (Capstone) — Comparative Analysis: Building a Peer Comp Table.