Level: Intermediate · Duration: ~15 minutes · Course 4 of 6 in the Intermediate track
Prerequisites: Beginner Course 2 (the fair value model), Beginner Course 4 (the three NAVs), Course I-1 (where the fair value note lives), and Course I-3 (adjusted book equity). This course converts you from a reader of management's marks into a builder of your own.
By the end of this course you will be able to:
- Dissect an investment property note: methods, cap rate disclosure, sensitivity table, appraisal mix
- Run three staleness tests on disclosed cap rates — against transactions, bond yields, and peers
- Translate a ±25 bps cap rate move into Reported NAV per unit, including the leverage amplification most analysts forget
- Build your own Real Estate NAV from the balance sheet up, with your own assumptions substituted for management's
- Back the market-implied cap rate out of the unit price and interpret the gap against disclosure
4.1 Anatomy of the fair value note
Beginner Course 2 established that a Canadian REIT's balance sheet is only as good as its marks. The investment property note is where those marks are documented, and it always contains the same five exhibits. Learn to read them as a package:
The method disclosure. Direct capitalization (stabilized NOI ÷ cap rate) for stable assets, discounted cash flow (typically 10-year, with a discount rate and terminal cap rate) for assets with lease-up or redevelopment stories. Most large REITs use both; the note says which applies where.
The key inputs table. Weighted-average cap rates, usually by asset class and sometimes by region. Choice Properties at December 31, 2025: 6.04% overall, 5.58% industrial, 5.11% mixed-use. These three numbers are the compression of tens of billions of dollars of judgment into disclosable form — everything in this course orbits them.
The sensitivity table. IFRS 13 requires disclosure of how fair value responds to changes in significant unobservable inputs. In practice: "a 25 bps increase in the weighted-average cap rate would decrease fair value by $X." Section 4.3 turns this compliance exhibit into your primary risk tool.
The appraisal mix. What fraction of the portfolio was externally appraised this period versus valued internally. There is no rule requiring external appraisal at all; a REIT that externally appraises a meaningful, rotating share is buying credibility. A portfolio that is 100% internally valued isn't necessarily wrong — but the marks are one management team's opinion, audited for process rather than re-derived.
The hierarchy classification. Investment property fair values are Level 3 — significant unobservable inputs — essentially always. The label is IFRS's own admission that these numbers are estimates resting on judgment. The auditor's key audit matter (Course I-1) almost always points here too.
4.2 Three staleness tests
Appraisals smooth. Cap rates in filings are updated quarterly at best, move in measured steps, and — through entirely human institutional caution — lag the market in both directions: too high late in a bull market for values, too low after rates rise. Your defense is triangulation. None of these tests proves a mark wrong; each mispricing signal you find is a hypothesis to investigate, and three agreeing signals are a finding.
Test 1 — transaction evidence. What have comparable portfolios and single assets actually traded at recently? Sources: the REIT's own dispositions (the cleanest test of all — did assets sell above or below carrying value? The MD&A discloses this), peers' disposition disclosures, and published cap rate surveys. A REIT consistently selling assets at or above IFRS carrying value is validating its own marks every quarter — this is among the strongest evidence available anywhere in REIT analysis. Persistent sales below carrying value indict the whole portfolio's marks, not just the assets sold.
Test 2 — the bond-yield spread. Cap rate minus the 10-year Government of Canada yield is real estate's risk premium. It is mean-reverting within a band for each asset class. When disclosed cap rates imply a spread far below historical norms — as happens after bond yields rise faster than appraisals adjust — the marks are probably stale-high, and the "Reported NAV discount" everyone cites is partly an artifact of an inflated Reported NAV. Beginner Course 4's Market-Implied NAV concept is this test wearing different clothes. (Spread norms are market-dependent — date-stamp any figures you publish.)
Test 3 — the peer cross-section. Line up disclosed cap rates for REITs holding similar assets in similar markets. Genuine portfolio-quality differences justify perhaps tens of basis points; a REIT marking materially tighter than every comparable peer is claiming its buildings are better than everyone else's — sometimes true, always worth a paragraph of justification you should go looking for.
4.3 The sensitivity table is a weapon — the math
The disclosed sensitivity ("±25 bps → ∓$X of fair value") is more useful than it looks, because you can extend it into the two numbers management never prints: percentage asset sensitivity and Reported NAV sensitivity.
The mechanics, from value = NOI ÷ cap rate. For the slice of the portfolio valued by directly capitalizing stabilized income at that rate, a 25 bps increase from a 6.04% base moves value by:
6.04 ÷ 6.29 − 1 = −3.97%
So roughly −4% on the directly-capitalized income assets per +25 bps at Choice-like cap rate levels — not −4% of total gross asset value. A real portfolio also carries development and lease-up assets valued by DCF, plus non-income assets, none of which the 6.04% weighted-average cap rate prices. So for the total-portfolio dollar move, start from the issuer's disclosed fair-value sensitivity — the "±25 bps → ∓$X" figure already blends every valuation method and segment weight — and reserve 6.04/6.29 − 1 for reasoning about the income-capitalized slice on its own. Note the asymmetry hiding in the algebra: −25 bps gives 6.04/5.79 − 1 = +4.3%. Cap rate compression helps more than the same decompression hurts, and the lower the starting cap rate, the more violent both effects become — a 4.00% apartment portfolio moves ~±6% on the same 25 bps.
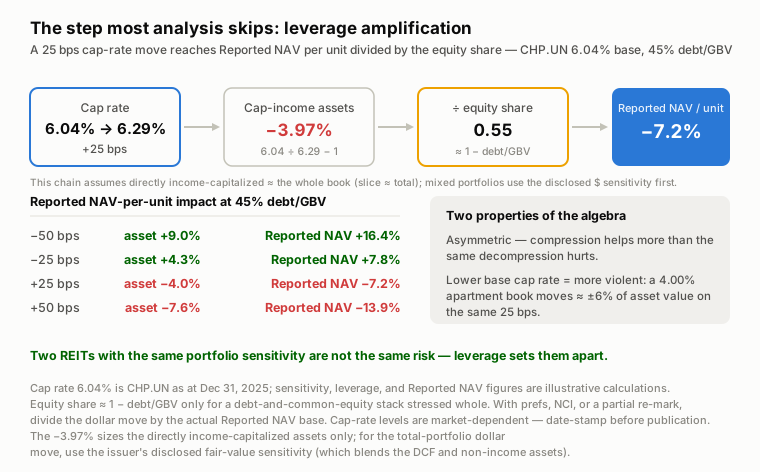
Now the step most published analysis skips: leverage amplification. Unitholders own the equity slice, not the assets, so a percentage move in gross asset value lands as a larger percentage move in Reported NAV. The exact way to size it: take the dollar fair-value move — the issuer's disclosed sensitivity, which already reflects the whole portfolio — and divide by the dollar Reported NAV base — economic equity, which is gross assets less debt, preferred, NCI, and other net liabilities. Where the capital stack is essentially just common equity and debt and you are stressing the whole book, that reduces to dividing the asset percentage by the equity share 1 − debt/GBV:
−3.97% ÷ 0.55 ≈ −7.2% of Reported NAV per 25 bps (0.55 = 1 − debt/GBV at 45% leverage)
Treat the whole −3.97% ÷ (1 − debt/GBV) shortcut as an approximation, not the definition — it makes two assumptions. On the asset side, −3.97% is the move on the income-capitalized slice, so it only stands in for the total portfolio when DCF-valued development/lease-up and non-income assets are immaterial; a book heavy in those needs the disclosed dollar sensitivity instead. On the capital side, 1 − debt/GBV is the equity share only when the REIT carries no material NCI, preferred, or other net liabilities and you are stressing the whole book; otherwise divide the dollar asset move by the actual Reported NAV base. Either way the lesson holds: two REITs with the same portfolio sensitivity are not the same risk, which is why the debt/GBV figure from Beginner Course 6 belongs in every valuation conversation. Build the little table for any REIT you cover: Reported NAV impact per ±25/±50/±100 bps, at actual leverage. Five minutes, and you now know more about the REIT's risk than its beta will ever tell you.
4.4 Building your own Real Estate NAV
This is a quick, hand-built estimate of a REIT's real-estate value from your own cap rates — a tool for interrogating management's mark, not a reproduction of a product figure. Treat it as an approximation: REIT Stack's published Real Estate NAV is computed by reit-nav-engine bottom-up as a forward-12-month sum-of-parts — every market × sector NOI capitalized at its own rate, then portfolio adjustments, less debt — so this balance-sheet shortcut (management's numbers where they survive interrogation, yours where they don't) approximates the same concept but will not reproduce the engine's number. The build, in order:
1. Start from adjusted book equity (Course I-3): reported IFRS equity plus the exchangeable-unit liability. For most Canadian REITs this is already close to Reported NAV — the fair value model does the heavy lifting, which is the great gift of IFRS to Canadian REIT analysis (a US REIT analyst must build asset value from scratch; you get to start from an audited estimate).
2. Re-mark the portfolio where your cap rate differs. Take the note's NOI-by-segment (or derive stabilized NOI from the MD&A), apply your cap rate from the 4.2 triangulation, and take the difference between your value and the carrying value through equity. You do not need to re-value every asset — adjust only the segments where the staleness tests fired. Discipline: write down why your cap rate differs, in basis points, with the evidence.
3. Sweep the non-IAS 40 items. Each is small; together they move your Real Estate NAV meaningfully:
- Debt at fair value. Statement debt is mostly amortized cost. Below-market fixed-rate debt locked in before a rate rise is an economic asset — the fair-value-of-debt disclosure in the notes quantifies it. Add the difference (both directions).
- Deferred taxes. Trust-level investment property generally carries no deferred tax for a qualifying REIT (the SIFT exception, Beginner Course 1) — but corporate subsidiaries inside the structure do; check the tax note before assuming zero.
- Development and land. Carried at fair value, but pipeline profit (value creation from projects not yet complete) is only partly in the marks. Credit something for a proven development platform, or nothing for a speculative one — but decide consciously.
- Platform and G&A. A capitalized value for management overhead (negative) or a fee-generating platform (positive). Frequently skipped; defensible either way if stated.
4. Divide by the fully exchanged unit count (Course I-3, period-end basis). The output: Real Estate NAV per unit, with a bridge from Reported NAV showing each adjustment. The bridge is the work product — anyone can assert a Real Estate NAV; the bridge is what makes yours checkable.
4.5 Closing the triangle: the market-implied cap rate
Beginner Course 4 gave you three NAVs; you can now compute the third one's engine yourself. Run the machine backwards:
- Market equity value = unit price × fully exchanged units.
- Implied gross asset value = market equity + total debt at face + preferred equity + non-controlling interests + other non-debt liabilities − non-NOI-producing assets (cash, land bank, development-in-progress, equity-accounted JV investments).
- Implied cap rate = portfolio NOI ÷ implied gross asset value.
Every capital-side claim goes into the bridge, not just debt. A REIT with a material non-controlling interest or other non-debt liabilities whose bridge stops at debt will understate implied GAV and so overstate the implied cap rate — and produce a number that no longer reconciles to REIT Stack's Market-Implied figure, which sums debt at face, preferred, minority interests, and other liabilities before subtracting non-NOI assets. Match the full stack — and mind the basis: the market-implied bridge uses debt at face, not the fair value of debt you added in the 4.4 Real Estate NAV rebuild. Those are two different exercises: 4.4 estimates economic value (fair-value-of-debt matters); this backs out what the market is paying against the reported capital stack (face debt is the consistent basis).
Compare the result with the disclosed 6.04%-style figure. If the market is pricing the portfolio at, say, an implied 6.75% against a disclosed 6.04%, the market is asserting management's marks are ~10% too rich or demanding extra compensation for leverage, structure, or management — usually some of each. The gap is not a buy signal by itself: the market has information too (Beginner Course 4's central warning). But the direction and trend of the gap, tracked over quarters and compared across peers, tells you whether skepticism about a REIT's marks is widening or closing — and after 4.2's staleness tests, you have an independent view on who's right. That triangulated judgment — disclosed vs implied vs your own — is the whole game of REIT valuation, and you now hold all three corners. (Numbers here are illustrative; compute from current filings and prices.)
Analyst callout — the traps in this course
The NOI inside the cap rate. "Stabilized NOI ÷ cap rate" — stabilized per whom? Vacancy assumptions, management fee deductions, and structural reserves inside the appraisal NOI differ across issuers. A tight cap rate on a generous NOI is double-flattery; the note's inputs table sometimes discloses the NOI assumptions, and the question is always worth asking.
Sensitivity without leverage. Quoting the disclosed "$X per 25 bps" without dividing by the equity share understates unitholder risk by 2x or more. Always convert to Reported NAV per unit terms.
Double-counting adjustments. If you re-mark the portfolio with your own cap rate and separately haircut your Real Estate NAV for "valuation risk," you have taken the same hit twice. One adjustment per sin.
Treating external appraisals as truth. External appraisers are hired by management, anchored on prior marks, and using the same comparable-scarce evidence. External appraisal upgrades the marks from "opinion" to "second opinion" — valuable, not dispositive.
Forgetting the exchangeables — again. Market cap for the implied-cap-rate calculation must use the fully exchanged count. The I-3 error resurfaces here with a new costume, and it's large enough to flip conclusions.
Key terms
| Term | Definition |
|---|---|
| Direct capitalization | Valuation as stabilized NOI ÷ capitalization rate; the workhorse method for stable income properties. |
| Terminal cap rate | Cap rate applied to exit-year NOI in a DCF; typically set above today's cap rate to reflect asset aging. |
| IFRS 13 / Level 3 | Fair value measurement standard and its hierarchy; investment property sits at Level 3 — significant unobservable inputs. |
| Sensitivity table | Required disclosure of fair value response to input changes; convertible into Reported NAV-per-unit risk with the leverage adjustment. |
| Appraisal mix | Share of portfolio externally vs internally valued in the period; a credibility signal, not a guarantee. |
| Cap rate spread | Cap rate minus the 10-year GoC yield; real estate's risk premium and the anchor of staleness Test 2. |
| Leverage amplification | Division of asset-value moves by the equity share (1 − debt/GBV); converts portfolio risk into unitholder risk. |
| Real Estate NAV | Your own hand-built estimate of a REIT's real-estate value — cap rates and sweep adjustments applied to the balance sheet, bridged line-by-line from reported figures; an approximation of, not a replica of, REIT Stack's engine-computed Real Estate NAV. |
| Market-implied cap rate | The cap rate that reconciles the current unit price to portfolio NOI; the market's verdict on the marks. |
| Fair value of debt | Disclosed economic value of debt vs its amortized-cost carrying value; below-market debt is an economic asset in your Real Estate NAV. |
Knowledge check
1. Choice disclosed a 6.04% weighted-average cap rate at December 31, 2025. Compute the approximate value impact of a +25 bps move on the directly income-capitalized assets, then the Reported NAV impact at 45% debt/GBV — and say where the total-portfolio dollar figure should come from instead.
Income-capitalized-slice impact: 6.04/6.29 − 1 ≈ −3.97%. Reported NAV impact (debt-and-common-equity shortcut, whole book): −3.97% ÷ 0.55 ≈ −7.2%. But −3.97% is not the total-GAV move — the weighted-average cap rate prices only the directly-capitalized assets, so the total-portfolio dollar figure comes from the issuer's disclosed fair-value sensitivity, which already blends the DCF-valued and non-income assets. The leverage step is the one to remember: unitholders experience portfolio moves amplified by the inverse of the equity share.
2. Why are a REIT's own asset sales the strongest available check on its marks, and what pattern would indict them?
Dispositions convert a Level 3 estimate into an observed price for the very assets on the balance sheet — no comparability adjustment needed. Sales consistently at or above carrying value validate the marks; a pattern of sales below carrying value implies the remaining (unsold, and likely less liquid) portfolio is marked too high.
3. Bond yields have risen 150 bps over a year, but a REIT's disclosed cap rates rose only 20 bps. What are the competing explanations, and how do you discriminate?
Either the risk premium (cap rate spread) was previously fat and has absorbed the move, or the marks are stale. Discriminate with the other two tests: recent transaction evidence at old-spread pricing supports the marks; peers marking wider and dispositions clearing below carrying value support staleness. Also check the market-implied cap rate — a large gap says the market has voted for staleness.
4. In a Real Estate NAV, why might you add value for a REIT's debt book, and where do you find the number?
If fixed-rate debt was locked below current market rates, the obligation's economic value is less than its carrying value — the REIT effectively owns a below-market financing asset that rolls off as debt matures. The fair-value-of-financial-instruments note discloses carrying vs fair value; the difference (positive or negative) belongs in the Real Estate NAV bridge.
5. Your Real Estate NAV is $14.00; Reported NAV is $15.50; the unit trades at $11.60. Construct the interpretation.
The market-implied valuation sits below even your skeptical Real Estate NAV: the market is pricing more than your cap-rate adjustment — some combination of further mark skepticism, leverage or structure discount, and management discount. Your work says Reported NAV overstates by ~10% ($1.50), and the remaining ~$2.40 gap to price is the market's additional charge. The next task is attribution: check the implied cap rate against transaction evidence to see how much of that charge is justified. What you may not do is call the full $3.90 gap "upside" — Beginner Course 4's warning stands.
Sources: Choice Properties REIT 2025 Annual Report, investment property note (cap rate disclosures as at December 31, 2025); IAS 40 Investment Property; IFRS 13 Fair Value Measurement; REALPAC NAV guidance. Sensitivity, leverage, and Real Estate NAV-bridge figures are illustrative calculations, labelled as such; spread norms and implied-cap-rate examples are market-dependent — date-stamp before publication.
Previous: Course I-3 — Units, Dilution, and Getting Per-Unit Math Right. Next in the track: Course I-5 — Same-Property NOI and the Operating Engine.