You'll learn: why leverage is intrinsic to REITs, the five metrics that describe it, how fair value accounting sneaks into leverage ratios, and how to spot refinancing risk before it becomes a distribution cut.
Assumed knowledge: Course 2 (fair value balance sheets), Course 4 (NAV and the leverage amplifier).
6.1 Leverage is the business model — and the failure mode
Real estate has always been financed with debt: rents are contractual and stable, so lenders advance a lot against them, and equity returns are amplified. A REIT is structurally a leveraged bet on property income. That works in both directions — Course 4 showed a 50 bp cap-rate move swinging NAV per unit ~14% because debt is fixed while asset values move.
Two structural points before the metrics:
- REITs cannot retain much cash. Flow-through status (Course 1) means most income goes out the door as distributions, so growth and refinancing depend on continuous access to debt and equity markets. A REIT's balance sheet isn't just a risk statement — it's its cost of growth.
- Leverage is capped by contract. Declarations of Trust typically set a maximum (often 60–65% of gross book value), and credit ratings impose tighter practical bounds. Investment-grade Canadian REITs generally operate in the 35–50% debt-to-assets range — exactly the spread visible among the largest names on the screener (Granite 35.0% to RioCan 48.9%).
6.2 The five metrics
1. Debt-to-total-assets (or debt-to-GBV) — how much of the portfolio is mortgaged? Total debt ÷ total assets, both off the fair-value balance sheet. The IFRS wrinkle: the denominator moves with property marks. If values are written down 10%, the ratio worsens with no new borrowing — leverage measured against fair values is partly a valuation output, not purely a financing choice. (Watch definitional variants: "adjusted" debt may include or exclude leases, hybrids, and JV proportionate share.) Rough bands for stabilized REITs: under ~40% conservative; 40–50% typical; above ~55% aggressive.
2. Debt-to-EBITDA — how many years of earnings to repay the debt? Immune to the marks problem: the denominator is earnings, not asset values. Canadian REITs report Debt-to-EBITDAFV — EBITDA with fair value adjustments excluded (that's the "FV"), for the Course 2 reasons. Below ~8× is broadly comfortable for investment-grade REITs; rating agencies watch this one hardest.
3. Interest coverage — how comfortably does income pay the interest bill? EBITDA ÷ interest expense. The metric that deteriorates fastest in a rate-hiking cycle, as cheap maturing debt rolls into expensive new debt. Above ~3× comfortable; near 2× strained; approaching 1.5×, the distribution is usually already in question.
4. The maturity ladder — when does the debt come due? No ratio — a table in every MD&A showing principal due each year, with the weighted-average interest rate and term. What you're looking for: no single year holding a dangerous concentration (a rule of thumb: alarm at much above ~15–20% of total debt in one year), and the gap between the average in-place rate and today's market rate — that gap is the earnings hit that arrives mechanically as each rung refinances. This is where 2022–24 hurt REITs: debt raised at 3% rolling at 5%+.
5. The unencumbered pool — what's not already pledged? Properties not pledged as mortgage collateral. A large unencumbered pool is dry powder — assets that can be mortgaged or sold quickly if markets freeze — and it's what backs unsecured debentures. Unsecured-heavy REITs (typically investment-grade) run large pools; mortgage-financed REITs run small ones and have less flexibility in a crunch.
6.3 Worked case — Choice Properties, FY2025
| Metric | Value | Reading |
|---|---|---|
| Adjusted debt-to-total-assets | 40.5% | Low end of typical; consistent with investment grade |
| Adjusted debt-to-EBITDAFV | 7.0× | Comfortable; management's own 2026 target is < 7.5× |
| Interest coverage | 3.2× | EBITDA covers interest 3× over — cushioned |
| Unencumbered properties | ~$13.8B | Very large vs. $15.8B total investment properties — an overwhelmingly unsecured balance sheet |
| Available liquidity | ~$1.5B credit capacity | Near-term maturities manageable without forced action |
The coherent picture: moderate leverage, earnings-based and asset-based measures agreeing, interest well covered, and a mostly unpledged portfolio. This balance sheet is why Choice's 88% AFFO payout (Course 3) reads as safe rather than stretched — and why its units yield less than higher-levered retail peers. Leverage context is always part of distribution safety: it's literally one of the risk escalators in REIT Stack's safety verdict.
Sources: Choice Properties FY2025 results release; 2025 Annual Report; Q1 2026 press release (leverage target).
Analyst note — how leverage kills REITs (a pattern, not a prediction): values fall → debt-to-assets rises toward covenant/rating limits → new debt gets expensive just as maturities arrive → interest coverage compresses → the distribution is cut to conserve cash → the units de-rate. Every stage is visible in advance in these five metrics. The REITs that get hurt are almost always the ones that entered the downturn above 50% leverage with concentrated maturities; the ones at 40% with big unencumbered pools get to go shopping instead.
6.4 A 60-second leverage read (checklist)
- Debt-to-assets vs. the 35–50% band — and vs. the REIT's own history.
- Debt-to-EBITDAFV under ~8×?
- Interest coverage ≥ 3×, and trending which way?
- Maturity ladder: any single-year concentration? In-place rate vs. market rate?
- Unencumbered pool: large and growing, or is everything already pledged?
- Cross-check: if debt-to-assets looks fine but debt-to-EBITDA looks bad, suspect the marks (Course 4's question all over again).
Diagram
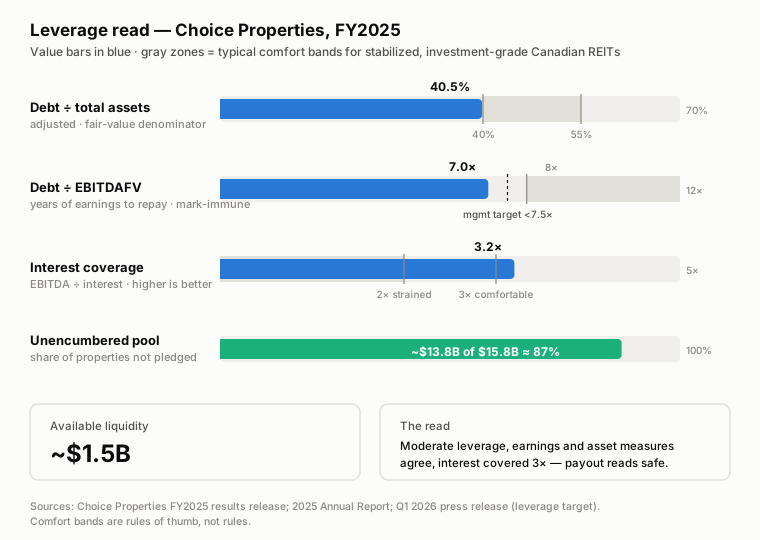
The five metrics as one panel: ratio gauges against their comfort bands, plus the unencumbered pool as a share of total properties.
Key terms
| Term | Definition |
|---|---|
| Debt-to-total-assets / GBV | Total debt ÷ total (fair value) assets. The headline leverage ratio; denominator moves with property marks. |
| Debt-to-EBITDAFV | Debt ÷ EBITDA excluding fair value adjustments — years of earnings to repay debt; mark-immune. |
| Interest coverage | EBITDA ÷ interest expense. The rate-cycle stress gauge. |
| Maturity ladder | The schedule of principal due by year; concentration and rate-gap risk live here. |
| Weighted-average interest rate / term | The blended cost and remaining life of in-place debt; compare the rate to today's market to see refinancing drag coming. |
| Unencumbered assets | Properties not pledged as mortgage collateral; flexibility reserve and the backing for unsecured debentures. |
| Covenant / DoT cap | Contractual leverage limits (Declaration of Trust, debenture indentures, bank lines) — usually ~60–65% of GBV. |
| Secured vs. unsecured debt | Mortgages on specific properties vs. debentures against the whole entity; unsecured-heavy = more flexibility, needs investment-grade access. |
Check your understanding
Q1. A REIT's debt-to-assets rises from 42% to 47% in a year in which total debt didn't change. What happened, and which other metric confirms it?
Q2. Why do Canadian REITs quote debt-to-EBITDAFV rather than plain debt-to-EBITDA?
Q3. Two REITs are both at 45% debt-to-assets. REIT A: weighted-average rate 3.1%, 40% of debt maturing within two years. REIT B: 4.8% rate, maturities spread evenly over eight years. Current market rates ~5%. Which faces more earnings risk, and through which metric will it show first?
Q4. Choice has ~$13.8B of unencumbered properties out of ~$15.8B total. Name two concrete options this gives management in a frozen credit market.
Q5. Use the checklist on this pattern: debt-to-assets 44% (fine), debt-to-EBITDAFV 11× (poor). What's your leading hypothesis?
Answers
A1. The denominator fell — property fair values were written down (~10%), so the ratio deteriorated with no new borrowing. Debt-to-EBITDAFV confirms the diagnosis: if earnings held up, it will have moved little, telling you the change is a valuation effect, not a financing one.
A2. Because IFRS net income (the top of the EBITDA build) contains large non-cash fair value swings on properties and exchangeable units (Course 2). Excluding fair value items ("FV") makes the denominator reflect recurring operating earnings, so the ratio measures debt against income that actually recurs.
A3. REIT A. Its cheap in-place debt (3.1%) must roll into a ~5% market with 40% of the stack maturing inside two years — a large, fast, mechanical increase in interest expense. It shows first in interest coverage (the denominator jumps as each tranche rolls), well before debt-to-assets moves at all. REIT B already pays near-market rates and refinances only ~12.5% per year.
A4. (1) Raise secured debt quickly — mortgage unencumbered buildings to generate liquidity when unsecured markets are shut; (2) sell unencumbered assets cleanly (no mortgage discharge/assumption friction) to fund maturities or buybacks. Either way, no forced action at fire-sale terms.
A5. The marks are likely flattering the asset-based ratio: debt measured against generous fair values looks moderate, but measured against actual earnings it's 11 years' worth. Suspect aggressive valuations (low cap-rate assumptions inflating the denominator) — exactly the Reported-vs-Real-Estate-NAV question from Course 4. Check the REIT's disclosed cap rates against market evidence, and check interest coverage for corroboration.
See it on REIT Stack
- The screener's Debt/Assets column — the largest covered names currently span 35.0% (Granite) to 48.9% (RioCan); you can now read that column as a risk spectrum rather than trivia.
- Methodology — elevated debt-to-assets is one of the one-way risk escalators in the distribution safety verdict.
You've finished the Beginner track. You can now read a Canadian REIT's structure, its IFRS financials, its FFO/AFFO and payout, its three NAVs, its distribution's tax character, and its balance sheet risk. The Intermediate track goes into the filings themselves: reading an MD&A end-to-end, same-property NOI, and the valuation labels in practice.