You'll learn: what FFO and AFFO are, the main adjustments that get you from IFRS net income to FFO to AFFO, what payout ratios built on them mean, and the traps in comparing them across REITs.
Assumed knowledge: Courses 1–2 — especially the fair-value and exchangeable-unit machinery, because FFO exists to undo it.
3.1 Why net income fails, and what replaces it
Course 2 ended with Choice Properties reporting a Q1 2026 net loss of $87.2M in a quarter where operations grew. The distortion runs in both directions: a quarter of large upward property revaluations can triple net income without a single extra dollar of rent.
The industry's answer is FFO — Funds From Operations: net income with the accounting noise reversed out, leaving a proxy for recurring operating earnings. In Canada the standard definition is published by REALPAC (the Real Property Association of Canada); the current white paper is the January 2022 edition, written specifically for IFRS reporters.
Two things to be clear about up front:
- FFO is not cash flow from operations, and it is not defined by IFRS. It's a non-GAAP measure. Under the CSA's National Instrument 52-112, any REIT publishing FFO must label it, explain its composition, and reconcile it to net income — which is why every MD&A contains a reconciliation table. Always read it.
- FFO is a convention. REITs can and do deviate from REALPAC in places ("FFO as adjusted", "Normalized FFO"). The reconciliation table tells you exactly what they did.
3.2 From net income to FFO
The REALPAC definition lists ~20 adjustments; four do most of the work for a typical Canadian REIT:
| Adjustment | Direction | Why |
|---|---|---|
| Fair value changes on investment properties | Reverse | Unrealized valuation swings, not operations (Course 2) |
| Fair value remeasurement of exchangeable units | Reverse | The price-up-equals-loss quirk (Course 2) |
| Distributions on exchangeable units booked as interest expense | Add back | Economically these are distributions to an equity-like holder, not financing cost |
| Gains/losses on property dispositions | Reverse | One-time; selling a building isn't recurring earnings |
Plus, where applicable: deferred taxes, impairments, transaction costs on business combinations, fair value changes on certain hedges, and adjustments for equity-accounted joint ventures.
Notice the pattern: almost every big FFO adjustment is reversing something IFRS fair-value accounting inserted. (US FFO, by contrast, mostly adds back depreciation — same goal, opposite distortion.) The add-back of exchangeable-unit distributions pairs with the denominator rule from Course 1: since those distributions are added back to the numerator, the exchangeable units must be included in the unit count — FFO per unit is a fully-exchanged figure.
Real reconciliation — Choice Properties, Q1 2026
| Amount | |
|---|---|
| Net loss (IFRS) | −$87.2M |
| Reverse: fair value gain on investment properties | −$79.0M |
| Reverse: fair value adjustment on exchangeable units | +$217.7M |
| Reverse: fair value change on Allied investment | +$49.5M |
| Add back: distributions on exchangeable units (in interest expense) + other REALPAC items | +$95.0M* |
| FFO | $196.0M |
| Weighted average diluted units (fully exchanged) | 723.8M |
| FFO per unit, diluted | $0.271 (+2.7% YoY) |
*Balancing figure — the itemized lines are in the Q1 2026 MD&A's non-GAAP section; the four fair-value reversals shown are the disclosed components. The structure is what matters here.
FY2025 told the same story: net loss of $61.2M, but FFO of $773.8M / $1.069 per unit, up 3.6% — the third consecutive year of per-unit growth. This is why the market prices REITs on FFO multiples and barely reacts to fair-value-driven net income swings.
Sources: Choice Properties Q1 2026 press release; FY2025 results release.
3.3 From FFO to AFFO: what does it cost to stay in business?
FFO still overstates distributable cash, because keeping buildings leased and functional costs real money that FFO doesn't charge. AFFO — Adjusted Funds From Operations — deducts the recurring costs of maintaining the income stream:
- Sustaining capital expenditures — roofs, HVAC, parking lots, elevators: capex that maintains (rather than grows) the portfolio;
- Leasing costs and tenant improvements — commissions and build-outs needed to keep space occupied;
- Straight-line rent reversal — IFRS smooths contractual rent escalations into a level average; AFFO puts back the cash rent actually collected.
So: FFO ≈ recurring operating earnings; AFFO ≈ recurring cash available to distribute. AFFO is always ≤ FFO for a normal REIT — REIT Stack's validation pipeline treats AFFO ≤ FFO as a hard cross-check on extracted data.
The soft spot: "sustaining" capex is management's own split of total capex, and classifying more of it as "value-add" flatters AFFO. When a REIT's AFFO payout looks surprisingly comfortable, the sustaining-capex assumption is the first thing to interrogate — compare it per square foot (or per suite) against sector peers.
3.4 Payout ratios — the number that answers "is the distribution safe?"
Divide distributions declared per unit by FFO or AFFO per unit:
Choice Properties, FY2025: distributions $0.76836 · FFO $1.069 · AFFO $0.873
- FFO payout: 0.76836 ÷ 1.069 = 71.9%
- AFFO payout: 0.76836 ÷ 0.873 = 88.0%
The AFFO payout is the binding one — it's measured against cash that's actually free. As rules of thumb for stabilized REITs: comfortably under ~90% leaves retained cash and a buffer; hovering near 100% means no margin for a bad year; persistently above 100% means the distribution is being funded by borrowing or dilution and is a cut candidate. Trajectory matters as much as level — a payout drifting from 80% to 95% over eight quarters is a warning even though both numbers are "under 100%."
This is exactly how REIT Stack's distribution safety verdict works: it "prioritizes AFFO payout ratio" and layers on risk escalators — past distribution cuts, elevated debt, rising payout trends — that can only worsen the verdict (Covered → Watch → Elevated risk), never improve it. Choice's 88.0% AFFO payout with flat trajectory currently earns Covered.
Comparison traps, quickly: (1) FFO definitions vary — check each REIT's reconciliation before comparing multiples; (2) a low payout isn't automatically "better" — it may reflect a growth strategy or a sector with heavy capex; (3) FFO yield (FFO ÷ price — the screener's 6.42% for CHP.UN) is the inverse of the P/FFO multiple institutions quote.
Diagram
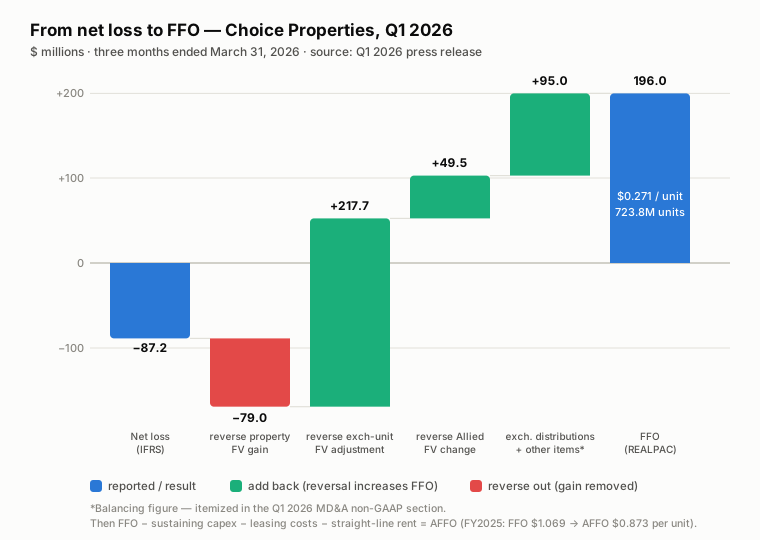
Waterfall from the reported net loss, through the fair-value reversals, to FFO — then the sustaining deductions down to AFFO.
Key terms
| Term | Definition |
|---|---|
| FFO | Funds From Operations: net income with fair value swings, disposition gains, and other non-operating items reversed. The Canadian REIT earnings yardstick (REALPAC, Jan 2022). |
| AFFO | FFO minus sustaining capex, leasing costs, tenant improvements, and straight-line rent — a proxy for distributable cash. |
| REALPAC | Industry association whose white paper standardizes Canadian FFO/AFFO definitions under IFRS. |
| Non-GAAP measure / NI 52-112 | FFO/AFFO aren't IFRS-defined; securities rules require labelling and reconciliation to net income in the MD&A. |
| Sustaining capex | Capex that maintains existing income (vs. value-add/development capex). Management-classified — scrutinize it. |
| Straight-line rent | IFRS levelling of contractual rent escalations; reversed in AFFO to reflect cash rent. |
| Payout ratio | Distributions ÷ FFO or AFFO. AFFO payout is the stricter, more meaningful test. |
| P/FFO, FFO yield | Price ÷ FFO per unit, and its inverse — the REIT world's P/E and earnings yield. |
Check your understanding
Q1. Choice's Q1 2026 net loss was $87.2M but FFO was +$196.0M. Name the three largest reversals that bridge the gap, with direction.
Q2. Why are distributions on exchangeable units added back in FFO, and what does that force you to do in the denominator?
Q3. A REIT reports FFO payout of 75% and AFFO payout of 103%. Interpret.
Q4. Two apartment REITs report identical AFFO per unit. REIT A assumes $450/suite annual sustaining capex; REIT B assumes $1,100/suite. Which AFFO do you trust more, and why?
Q5. Where must a REIT show you exactly how it computed FFO, and which regulation requires it?
Answers
A1. Reverse the $79.0M fair value gain on investment properties (subtract); reverse the $217.7M unfavourable exchangeable-unit fair value adjustment (add back); reverse the $49.5M unfavourable Allied Properties fair-value change (add back). Together with the exchangeable-unit distributions add-back and smaller REALPAC items, that bridges −$87.2M to +$196.0M.
A2. In net income those distributions sit in interest expense because the units are IAS 32 liabilities; economically they're distributions to an equity-like holder, so FFO adds them back. Having done so, the exchangeable units must be included in the per-unit denominator — hence fully-exchanged diluted units (723.8M for Choice), or FFO per unit would be overstated.
A3. After real sustaining costs, the REIT is paying out more cash than it generates (103% of AFFO) even though FFO coverage looks fine. The gap between 75% and 103% says maintenance capex and leasing costs are consuming ~27 points of FFO. Unless temporary (a one-time leasing surge), the distribution is being funded by the balance sheet — elevated cut risk.
A4. REIT B's, other things equal. A $450/suite assumption is aggressive — apartments cost more than that to maintain over a cycle — so REIT A's AFFO (and its payout ratio) is flattered by classification choices. Cross-check both against sector norms and against each REIT's actual historical capex.
A5. In the non-GAAP measures section of the MD&A: a quantitative reconciliation from net income to FFO/AFFO, with labelling and composition disclosure, required by CSA National Instrument 52-112 (non-GAAP and other financial measures).
See it on REIT Stack
- The screener's FFO yield column — CHP.UN at 6.42%, REI.UN at 7.95%, PMZ.UN at 9.24%: now you can read the spread as the market's quality/growth ranking.
- Methodology — the 14 cross-field reconciliations include FFO derivation and AFFO ≤ FFO checks on every extraction.
Next course: the balance-sheet counterpart. If FFO is the earnings yardstick, NAV is the value yardstick — and there are three of them.