You'll learn: how IAS 40 fair value accounting works, what it does to the balance sheet and income statement, why it makes Canadian and US REIT financials non-comparable, and the IAS 32 quirk that can turn a good quarter into a reported net loss.
Assumed knowledge: Course 1; comfort reading a balance sheet and income statement.
2.1 One election that changes everything
Canada adopted IFRS for public companies in 2011. Under IAS 40 (Investment Property), an entity that holds property to earn rent must choose one of two models for its entire portfolio:
- Cost model: carry buildings at historical cost less depreciation (what US GAAP requires).
- Fair value model: carry buildings at their current estimated market value, remeasured every reporting period, with the change flowing through profit or loss.
Virtually every Canadian REIT elected the fair value model. Three consequences follow, and they shape everything else in this track:
- The balance sheet shows today's values. "Investment properties" is management's current estimate of what the portfolio is worth — not a 1998 purchase price minus 28 years of depreciation.
- Depreciation of investment property disappears. You don't depreciate an asset you remeasure to market each quarter.
- Net income contains large unrealized, non-cash swings. Every quarter's revaluation gain or loss lands in the income statement, on top of actual rental operations.
The US contrast — why cross-border comparisons break
US GAAP offers no fair value option for an operating company's real estate. US REITs carry buildings at depreciated historical cost, forever, with no upward revaluation. So:
| Canadian REIT (IFRS, fair value) | US REIT (US GAAP, cost) | |
|---|---|---|
| Balance sheet property value | Current market estimate | Historical cost − accumulated depreciation |
| Book equity per unit | Meaningful — approximates NAV | Nearly meaningless as a value measure |
| Depreciation expense | None on investment property | Large, recurring |
| Net income | Distorted upward/downward by unrealized fair value swings | Distorted downward by depreciation |
This is why price-to-book is a usable ratio for Canadian REITs and a useless one for US REITs, and why FFO (Course 3) exists on both sides of the border but adjusts for different things.
2.2 Where the fair values come from
Fair values are estimates, and the inputs are disclosed. Most large REITs use a discounted cash flow (DCF) approach — project each property's cash flows over ~10 years, discount them, and add a terminal value based on a capitalization rate — or a direct capitalization approach (stabilized NOI ÷ cap rate).
A cap rate is the yield a buyer demands on a property's net operating income: a building producing $6M of NOI valued at a 6.0% cap rate is worth $100M. Lower cap rate ⇒ higher value, and the relationship is powerfully non-linear (Course 4 quantifies this).
Real disclosure — Choice Properties, December 31, 2025:
| Input (weighted average) | Overall | Retail | Industrial | Mixed-Use |
|---|---|---|---|---|
| Capitalization rate | 6.04% | 6.28% | 5.58% | 5.11% |
| Terminal cap rate | 6.29% | 6.51% | 5.90% | 5.32% |
| Discount rate | 7.06% | 7.26% | 6.73% | 6.08% |
These tables (in the financial statement notes) are among the most analytically valuable disclosures a REIT makes: they let you judge whether management's marks are aggressive or conservative against market evidence. Note industrial and mixed-use carry lower cap rates (higher values per dollar of NOI) than retail — that's the market's growth expectation, not an accounting choice.
Source: Choice Properties 2025 Annual Report.
Analyst note: management values its own portfolio (most REITs get periodic external appraisals on a rotating subset). The estimates are audited but remain Level 3 — judgment-heavy. This is precisely why REIT Stack's Real Estate NAV re-derives values from market cap rates as a cross-check on reported marks — more in Course 4.
2.3 The exchangeable-unit quirk: when a rising unit price creates a "loss"
Now the strangest thing in Canadian REIT accounting — and it isn't optional to understand, because it dominates the net income line of several large REITs.
The rule. Under IAS 32, an instrument the holder can put back to the issuer for cash is a financial liability, not equity. REIT trust units are redeemable at the holder's option, but they survive in equity through IAS 32's puttable exemption — available only to the most subordinate class of instruments. The exchangeable LP units you met in Course 1 sit in a subsidiary partnership, are not the most subordinate class of the consolidated group, and therefore cannot use the exemption. They are classified as liabilities, measured at fair value through profit or loss — and their fair value is the REIT's own unit price.
The consequence. When the unit price rises, the exchangeable-unit liability rises, and the REIT books a loss. When the price falls, it books a gain. And the distributions paid on exchangeable units are recorded as interest expense.
Real example — Choice Properties, Q1 2026 (three months ended March 31, 2026)
| Line | Amount |
|---|---|
| Fair value gain on investment properties | +$79.0M |
| Fair value adjustment on Exchangeable Units (unit price rose) | −$217.7M |
| Fair value change, Allied Properties investment | −$49.5M |
| Reported net loss | −$87.2M |
| FFO — the operating cash-flow proxy (Course 3) | +$196.0M |
A quarter with growing rents, a $79M property revaluation gain, and $196M of operating funds flow — reported as an $87M net loss, mostly because the units Weston holds became more valuable. On Choice's balance sheet the exchangeable units sat as a $6.08B liability at March 31, 2026, against only ~$4.4B of reported unitholders' equity.
Same pattern at annual scale: Choice's FY2025 net result was a $61.2M loss (versus $784.4M net income in 2024) — driven by a $577.8M unfavourable exchangeable-unit adjustment (a $748.0M swing versus 2024's favourable one), even though investment properties were written up $144.3M and FFO grew 3.6%. The accounting noise didn't just obscure a good year; it inverted its sign.
Sources: Choice Properties Q1 2026 press release; FY2025 results release; 2025 Annual Report.
How to read a Canadian REIT income statement
Practical reading order, once you know the quirk:
- Ignore headline net income until you know what's in it.
- Find the fair value adjustment lines — investment properties, exchangeable units/unit-based liabilities, financial instruments.
- Judge operations on NOI (rental revenue minus property operating costs) and FFO (Course 3).
- Treat the property fair value line as valuation information (are the marks moving up or down, and why — cap rates or NOI?), not as earnings.
- Remember exchangeable-unit "losses" usually mean the unit price went up. If anything, they're a contrarian tell.
Diagram
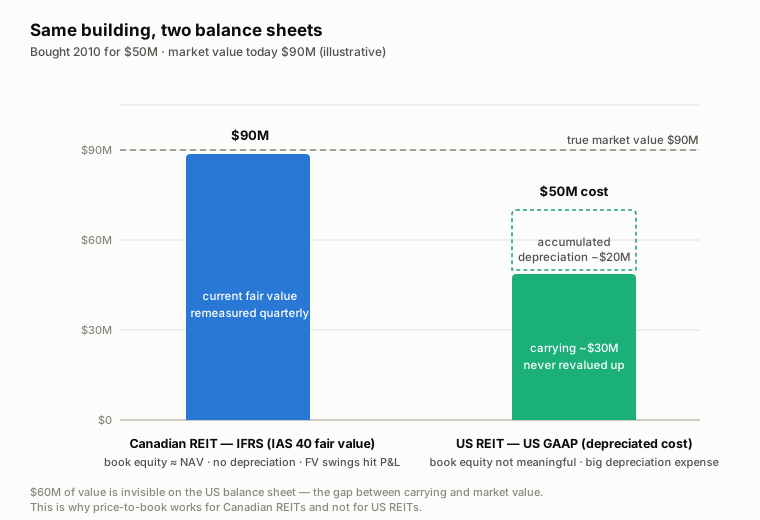
Left: the Canadian balance sheet carries property at current fair value and book equity approximates NAV. Right: the US balance sheet carries depreciated cost; equity loses meaning as a value measure.
Key terms
| Term | Definition |
|---|---|
| IAS 40 | The IFRS standard for investment property; offers the fair value or cost model. Canadian REITs almost universally use fair value. |
| Fair value model | Property remeasured to estimated market value each period; changes flow through profit or loss; no depreciation. |
| Investment property | Property held to earn rent or for capital appreciation — the main asset line on a REIT balance sheet. |
| Cap rate | NOI ÷ value. The yield used to convert a property's income into a valuation; lower cap rate = higher value. |
| NOI | Net operating income: rental revenue minus property-level operating expenses. The cleanest measure of what the buildings earn. |
| Level 3 inputs | Fair value inputs that are unobservable (management estimates) — where all property valuations live. |
| IAS 32 / puttable exemption | The rule that classifies redeemable units as liabilities, with an exemption that keeps the most subordinate class (trust units) in equity. |
| FVTPL | Fair value through profit or loss — how exchangeable units are measured; the source of the price-up-equals-loss effect. |
Check your understanding
Q1. A Canadian REIT and a US REIT each bought an identical building for $50M in 2010; it's worth $90M today. What does each balance sheet show, roughly?
Q2. Choice Properties reported an $87.2M net loss in Q1 2026. An investor concludes the quarter went badly. Correct the record using two numbers from this course.
Q3. Why does a rising CHP.UN unit price generate an accounting loss for Choice Properties?
Q4. Where would you look, in a REIT's filings, to judge whether management's property values are aggressive?
Q5. Why are REIT trust units — which holders can redeem for cash — shown in equity, while exchangeable LP units are liabilities?
Answers
A1. The Canadian REIT shows ~$90M (current fair value, remeasured each period, revaluation gains having flowed through P&L over the years). The US REIT shows $50M less 16 years of accumulated depreciation — perhaps $30M — with no upward revaluation permitted.
A2. FFO was +$196.0M (up 2.7% per unit) and investment properties were revalued upward by $79.0M. The net loss came almost entirely from the −$217.7M fair value adjustment on exchangeable units — a non-cash accounting charge caused by the unit price rising during the quarter.
A3. The exchangeable units are classified as financial liabilities measured at fair value through profit or loss, and their fair value tracks the trust unit price. Price up ⇒ liability up ⇒ remeasurement loss in net income (and vice versa).
A4. The fair value input disclosures in the financial statement notes — weighted average cap rates, terminal cap rates, and discount rates by asset class (e.g., Choice's 6.04% overall cap rate at Dec 31, 2025) — compared against current market transaction evidence and appraisal data.
A5. IAS 32's puttable exemption permits equity classification only for the most subordinate class of puttable instruments — the trust units qualify. Exchangeable units of a subsidiary LP are not the consolidated group's most subordinate class, so the exemption is unavailable and default liability treatment applies.
See it on REIT Stack
- Methodology — how REIT Stack validates extracted balance-sheet data (cap-rate plausibility bands of 3–10%, cross-period continuity checks) and why Reported NAV is "internally consistent within each issuer but not comparable across the universe."
- REIT Stack screener — open the current sample analysis to see how fair-value reporting flows into Reported NAV.
Next course: if net income is this noisy, what number do you use? FFO and AFFO — the cash-flow language every REIT investor speaks.