You'll learn: what NAV is and how it's computed, why the same REIT can legitimately have three different NAVs, the cap-rate arithmetic that makes NAV so sensitive, and how to interpret price-to-NAV premiums and discounts without fooling yourself.
Assumed knowledge: Courses 1–3, especially fair value accounting and the fully-exchanged unit count.
4.1 What NAV is
Net asset value (NAV) per unit answers: if the REIT's properties are worth X and its debts are Y, what is each unit's share of what's left?
NAV per unit = (fair value of assets − liabilities, excluding unit-like liabilities) ÷ fully-exchanged units
Because Canadian REITs carry properties at fair value (Course 2), a Canadian REIT's balance sheet already contains the ingredients — this is why NAV is a first-class metric in Canada while US analysts must rebuild it from scratch.
One Canadian wrinkle before the formula works: put the exchangeable units back in equity. On the IFRS balance sheet they sit as a liability at market value (Course 2). Treat them as the equity they economically are, or NAV per unit comes out wrong.
Choice Properties, March 31, 2026 — disclosed NAV $14.53:
| IFRS equity (trust unitholders only) | $4.435B |
| Add back: exchangeable units liability | +$6.079B |
| Economic equity | $10.514B |
| ÷ fully-exchanged units | 723.8M |
| NAV per unit | $14.53 |
Naively dividing IFRS equity by trust units ($4.435B ÷ 328.0M ≈ $13.52) gives a wrong-looking number that appears in no filing — a classic beginner error the exchangeable-unit add-back fixes.
Source: Choice Properties Q1 2026 press release. The figures are a dated case study, not a current profile snapshot.
4.2 Why one NAV is never enough
NAV looks objective — it's just assets minus debts — but its dominant input is the estimated value of buildings that haven't traded. Three legitimate answers exist to "what are the buildings worth?", and they define the three NAVs used on REIT Stack:
1. Reported NAV — management's answer. Per-unit NAV as published in the issuer's MD&A under the IFRS fair-value election. Built from audited fair-value marks (though the NAV-per-unit measure itself is a non-GAAP figure in the unaudited MD&A), and internally consistent within each issuer — but each management team chooses its own cap-rate assumptions, so it is not comparable across the universe. One team's 6.0% is another's 6.5% for similar assets.
2. Real Estate NAV — the market-evidence answer. An independent rebuild: take each market × sector cell's in-place NOI, grow it to a single forward figure, capitalize it at that cell's market cap rate; the cells sum to gross asset value (GAV), and the bridge is GAV + adjustments − debt. Deliberately stabilized, and comparable across REITs and across quarters, because every REIT is marked with the same market ruler.
3. Market-Implied NAV — the market price's answer. Backsolved live from the unit price: reverse from price to the GAV the market is implicitly paying for. It's the cross-check that tells you what cap rate the stock market is applying to the portfolio — recomputed continuously as the price moves.
The three-way spread is the analysis. Reported ≫ Real Estate NAV: management's marks look aggressive versus market evidence. Market-Implied ≪ both: the stock market disbelieves the private-market values — or is offering a bargain. That's the question NAV analysis exists to pose.
4.3 The cap-rate lever
NAV's sensitivity comes from arithmetic, amplified by leverage. Illustrative (round numbers, not a real REIT):
A portfolio produces $600M of NOI, carries $4.0B of debt, and has 500M units.
| Cap rate | GAV ($600M ÷ rate) | − Debt | NAV | NAV/unit |
|---|---|---|---|---|
| 5.50% | $10.91B | $4.0B | $6.91B | $13.82 |
| 6.00% | $10.00B | $4.0B | $6.00B | $12.00 |
| 6.50% | $9.23B | $4.0B | $5.23B | $10.46 |
A 50-basis-point cap-rate move — well within honest professional disagreement — swings NAV per unit by ~13–15%. Leverage is the amplifier: the cap rate moves GAV by ~8%, but debt is fixed, so equity absorbs the entire change. This is why small differences in valuation assumptions produce big differences between Reported and Real Estate NAV, and why you should never treat any NAV as precise to the decimal.
4.4 Premiums and discounts — reading P/NAV
P/NAV = unit price ÷ NAV per unit. Above 1.0×, the market pays more than appraised value; below, less. Two dated cases using prices from July 1, 2026:
CHP.UN — a premium. Price $16.34 vs Reported NAV $14.53 ⇒ ~1.13×, a 12.5% premium. The market pays above appraised value — consistent with prized grocery-anchored assets, an investment-grade balance sheet, and confidence in management's marks. A premium also matters mechanically: a REIT trading above NAV can issue units accretively to fund acquisitions.
CAR.UN — a deep discount. Price $34.88 vs Reported NAV $54.79 ⇒ ~0.64×, a 36.3% discount. The market is paying 64 cents per dollar of appraised apartment value. A discount this size is a disagreement demanding explanation, with three candidate readings:
- The marks are stale/optimistic — private apartment values haven't fully reflected current interest rates (Reported vs Real Estate NAV comparison tests this);
- The market is pricing risks beyond the assets — rent control/regulatory exposure, operating cost inflation, financing costs;
- Mispricing — the value case. Apartment REITs trading far below replacement cost is a recurring Canadian institutional-investor thesis, and persistent wide discounts historically attract privatization bids.
Usually the truth mixes all three. The discipline: a discount is a question, not an answer. NAV is not a price target — REITs can trade below NAV for years (Canadian office REITs have spent much of the 2020s there). What closes a gap is a catalyst: asset sales at or above the marks (proof the NAV is real), buybacks, privatization, or a rate cycle turning.
Analyst note: always ask which NAV a P/NAV uses. Screeners typically use Reported NAV; a bank analyst quoting "P/NAV" may mean their own estimate closer to a Real Estate NAV. The same stock can show a 0.9× and a 1.05× P/NAV in two sources, both "correct."
Diagram
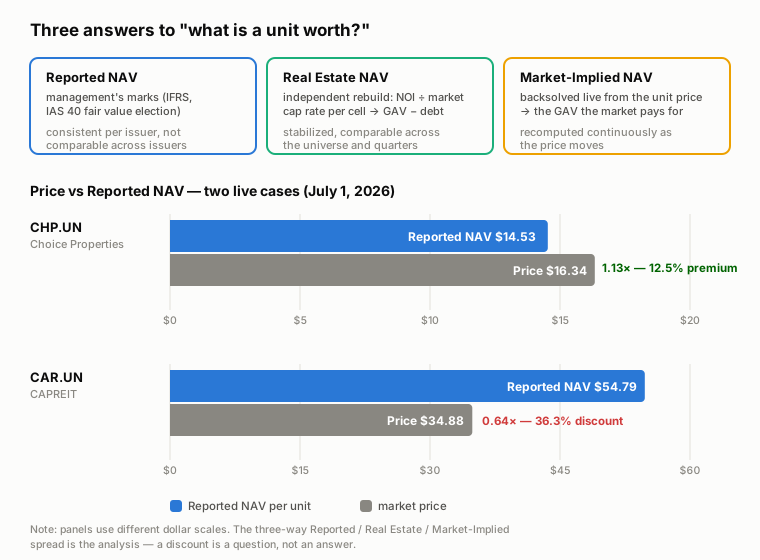
Reported NAV, Real Estate NAV, and Market-Implied NAV as three rulers against one unit price — CHP.UN trading above its Reported NAV, CAR.UN far below.
Key terms
| Term | Definition |
|---|---|
| NAV per unit | Economic equity (including exchangeable units) ÷ fully-exchanged units. The REIT's per-unit asset backing. |
| Reported NAV | NAV as published by the issuer under its IFRS fair-value marks. Consistent within an issuer; not comparable across issuers. |
| Real Estate NAV | Independently rebuilt NAV using market cap rates per market × sector cell. Comparable across the universe. |
| Market-Implied NAV | The valuation backsolved from the live unit price — what the market is actually paying for. |
| GAV | Gross asset value: the value of the property portfolio before deducting debt. |
| P/NAV | Price ÷ NAV. Premium >1.0×, discount <1.0×. Always ask which NAV is the denominator. |
| Cap-rate sensitivity | Small cap-rate changes produce large NAV swings because leverage concentrates the entire GAV change in equity. |
| Catalyst | An event (asset sales, buyback, privatization) that forces price and NAV toward each other. Discounts without catalysts can persist for years. |
Check your understanding
Q1. Compute Choice's NAV per unit from: IFRS trust-unitholders' equity $4.435B, exchangeable-unit liability $6.079B, trust units 328.0M, exchangeable units 395.8M. Why must you not use $4.435B ÷ 328.0M?
Q2. Using the illustrative portfolio in 4.3 ($600M NOI, $4.0B debt, 500M units): a valuer moves the cap rate from 6.00% to 5.75%. New NAV per unit?
Q3. CAR.UN trades at 0.64× Reported NAV. Give one reading under which this is a buying opportunity and one under which it isn't.
Q4. A REIT's Reported NAV is $20; a stabilized market-cap-rate rebuild (Real Estate NAV) gives $16; the stock trades at $15. Interpret the three-way spread.
Q5. Why can a REIT trading at a premium to NAV grow per-unit value faster than an identical one at a discount?
Answers
A1. Economic equity = $4.435B + $6.079B = $10.514B; fully-exchanged units = 328.0M + 395.8M = 723.8M; NAV = $10.514B ÷ 723.8M ≈ $14.53. Using $4.435B ÷ 328.0M mixes an equity figure that excludes the exchangeable holders with a unit count that also excludes them — but the exchangeable units are equity economically, so both numerator and denominator must include them.
A2. GAV = $600M ÷ 5.75% = $10.435B; NAV = $10.435B − $4.0B = $6.435B; per unit = $6.435B ÷ 500M ≈ $12.87 — a 7.2% jump in NAV per unit from a 25 bp assumption change. (Leverage amplification at work.)
A3. Opportunity: the appraised values are real (verifiable if the REIT sells assets at or near its marks), and you're buying apartments at ~64% of private-market value — well below replacement cost — with privatization or buybacks as catalysts. Not: the marks are stale for the current rate environment and the "true" (Real Estate / Market-Implied) NAV is far lower, so the discount is partly illusory; meanwhile regulatory and cost pressures justify a structurally lower multiple. Deciding between these is the actual work.
A4. The market-evidence rebuild ($16) sits well below management's marks ($20), suggesting the reported values are rich against current market cap rates. The price ($15) sits just below the Real Estate NAV — so the market broadly agrees with the stabilized rebuild and applies a small further haircut. The headline "25% discount to NAV" is mostly a disagreement about marks, only slightly a bargain.
A5. At a premium, issuing new units raises more cash per unit than the assets behind each existing unit are worth, so acquisitions funded by issuance are accretive to NAV per unit. At a discount, issuance dilutes NAV per unit (and buybacks would be the accretive move instead).
See it on REIT Stack
- Methodology — the three valuation labels: the definitions this course is built on.
- REIT Stack screener — compare the current active universe or open the configured sample analysis.
- The screener's P/NAV column — compare the current spectrum of market agreement and disagreement. Screener multiples update with each price snapshot, so they will differ from the dated worked examples above.
Next course: the reason most people own REITs in the first place — the distribution: how safe it is, and how it's taxed.